我在ggplot2中有一个三面板的显示。这些面板是垂直排列的。
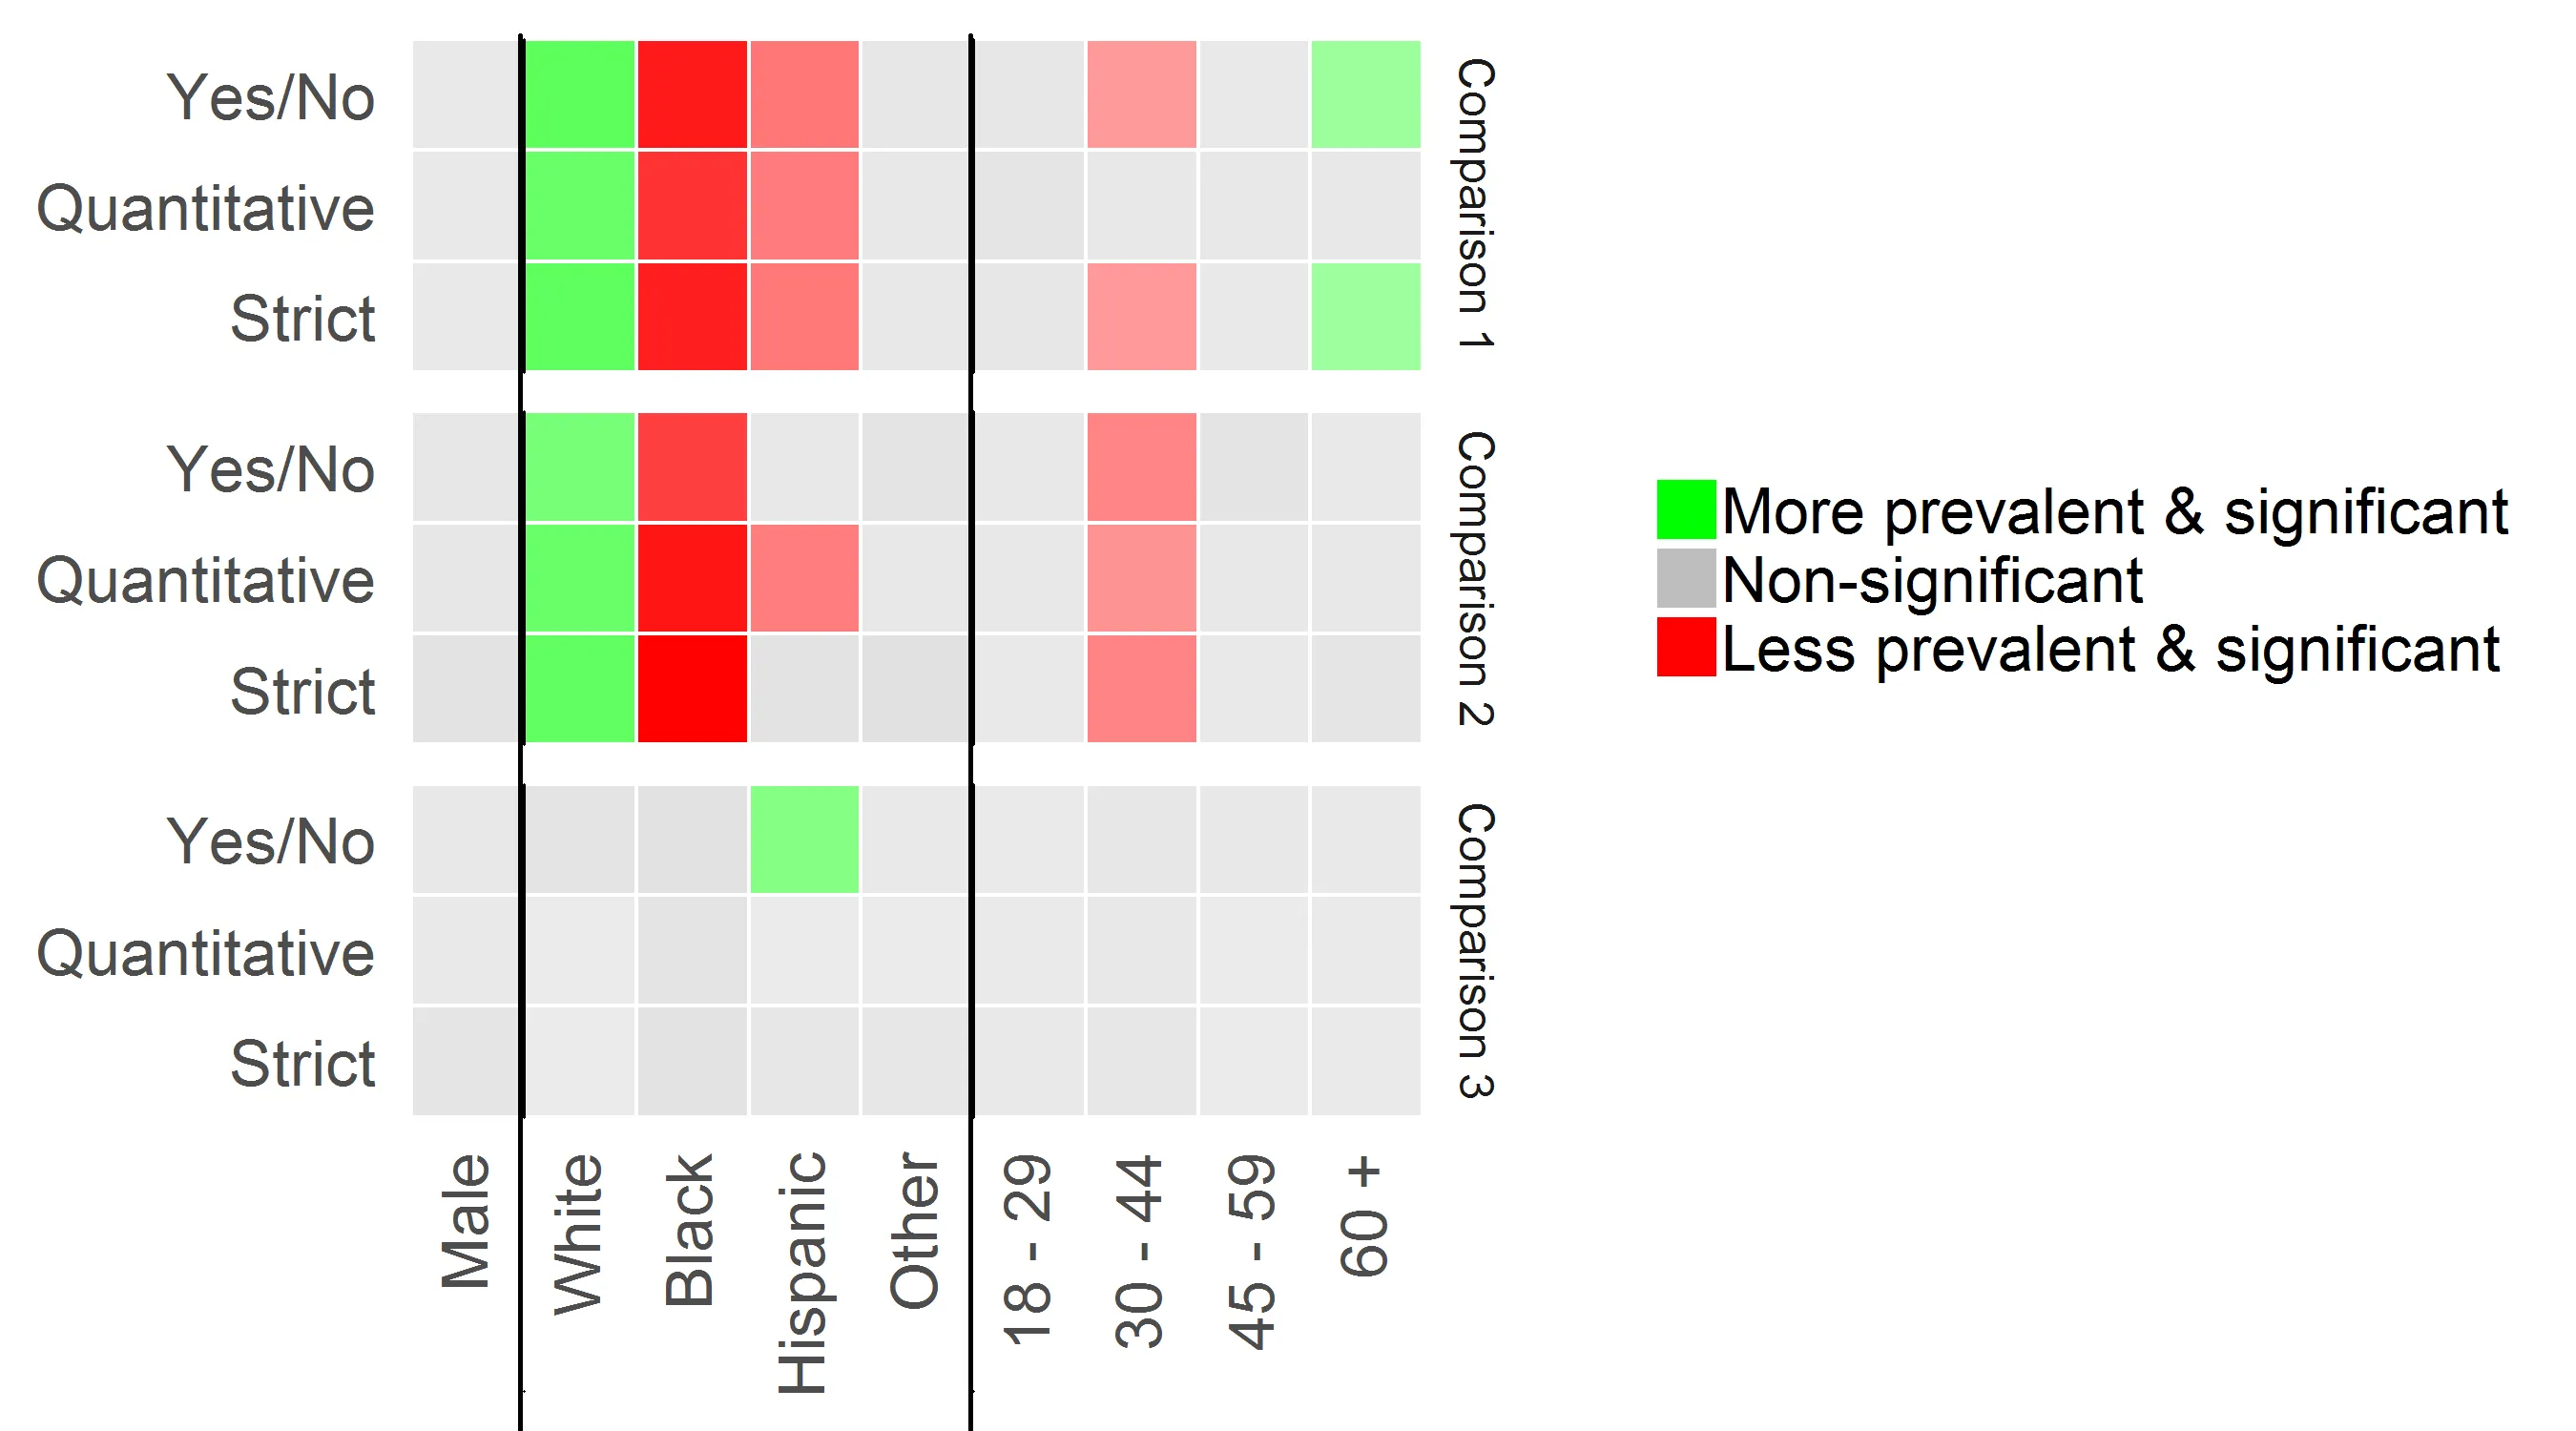
我试图添加三条垂直线,使它们穿过所有面板。换句话说,这些垂直线不应该被裁剪到绘图区域内。 这是我想要的效果:
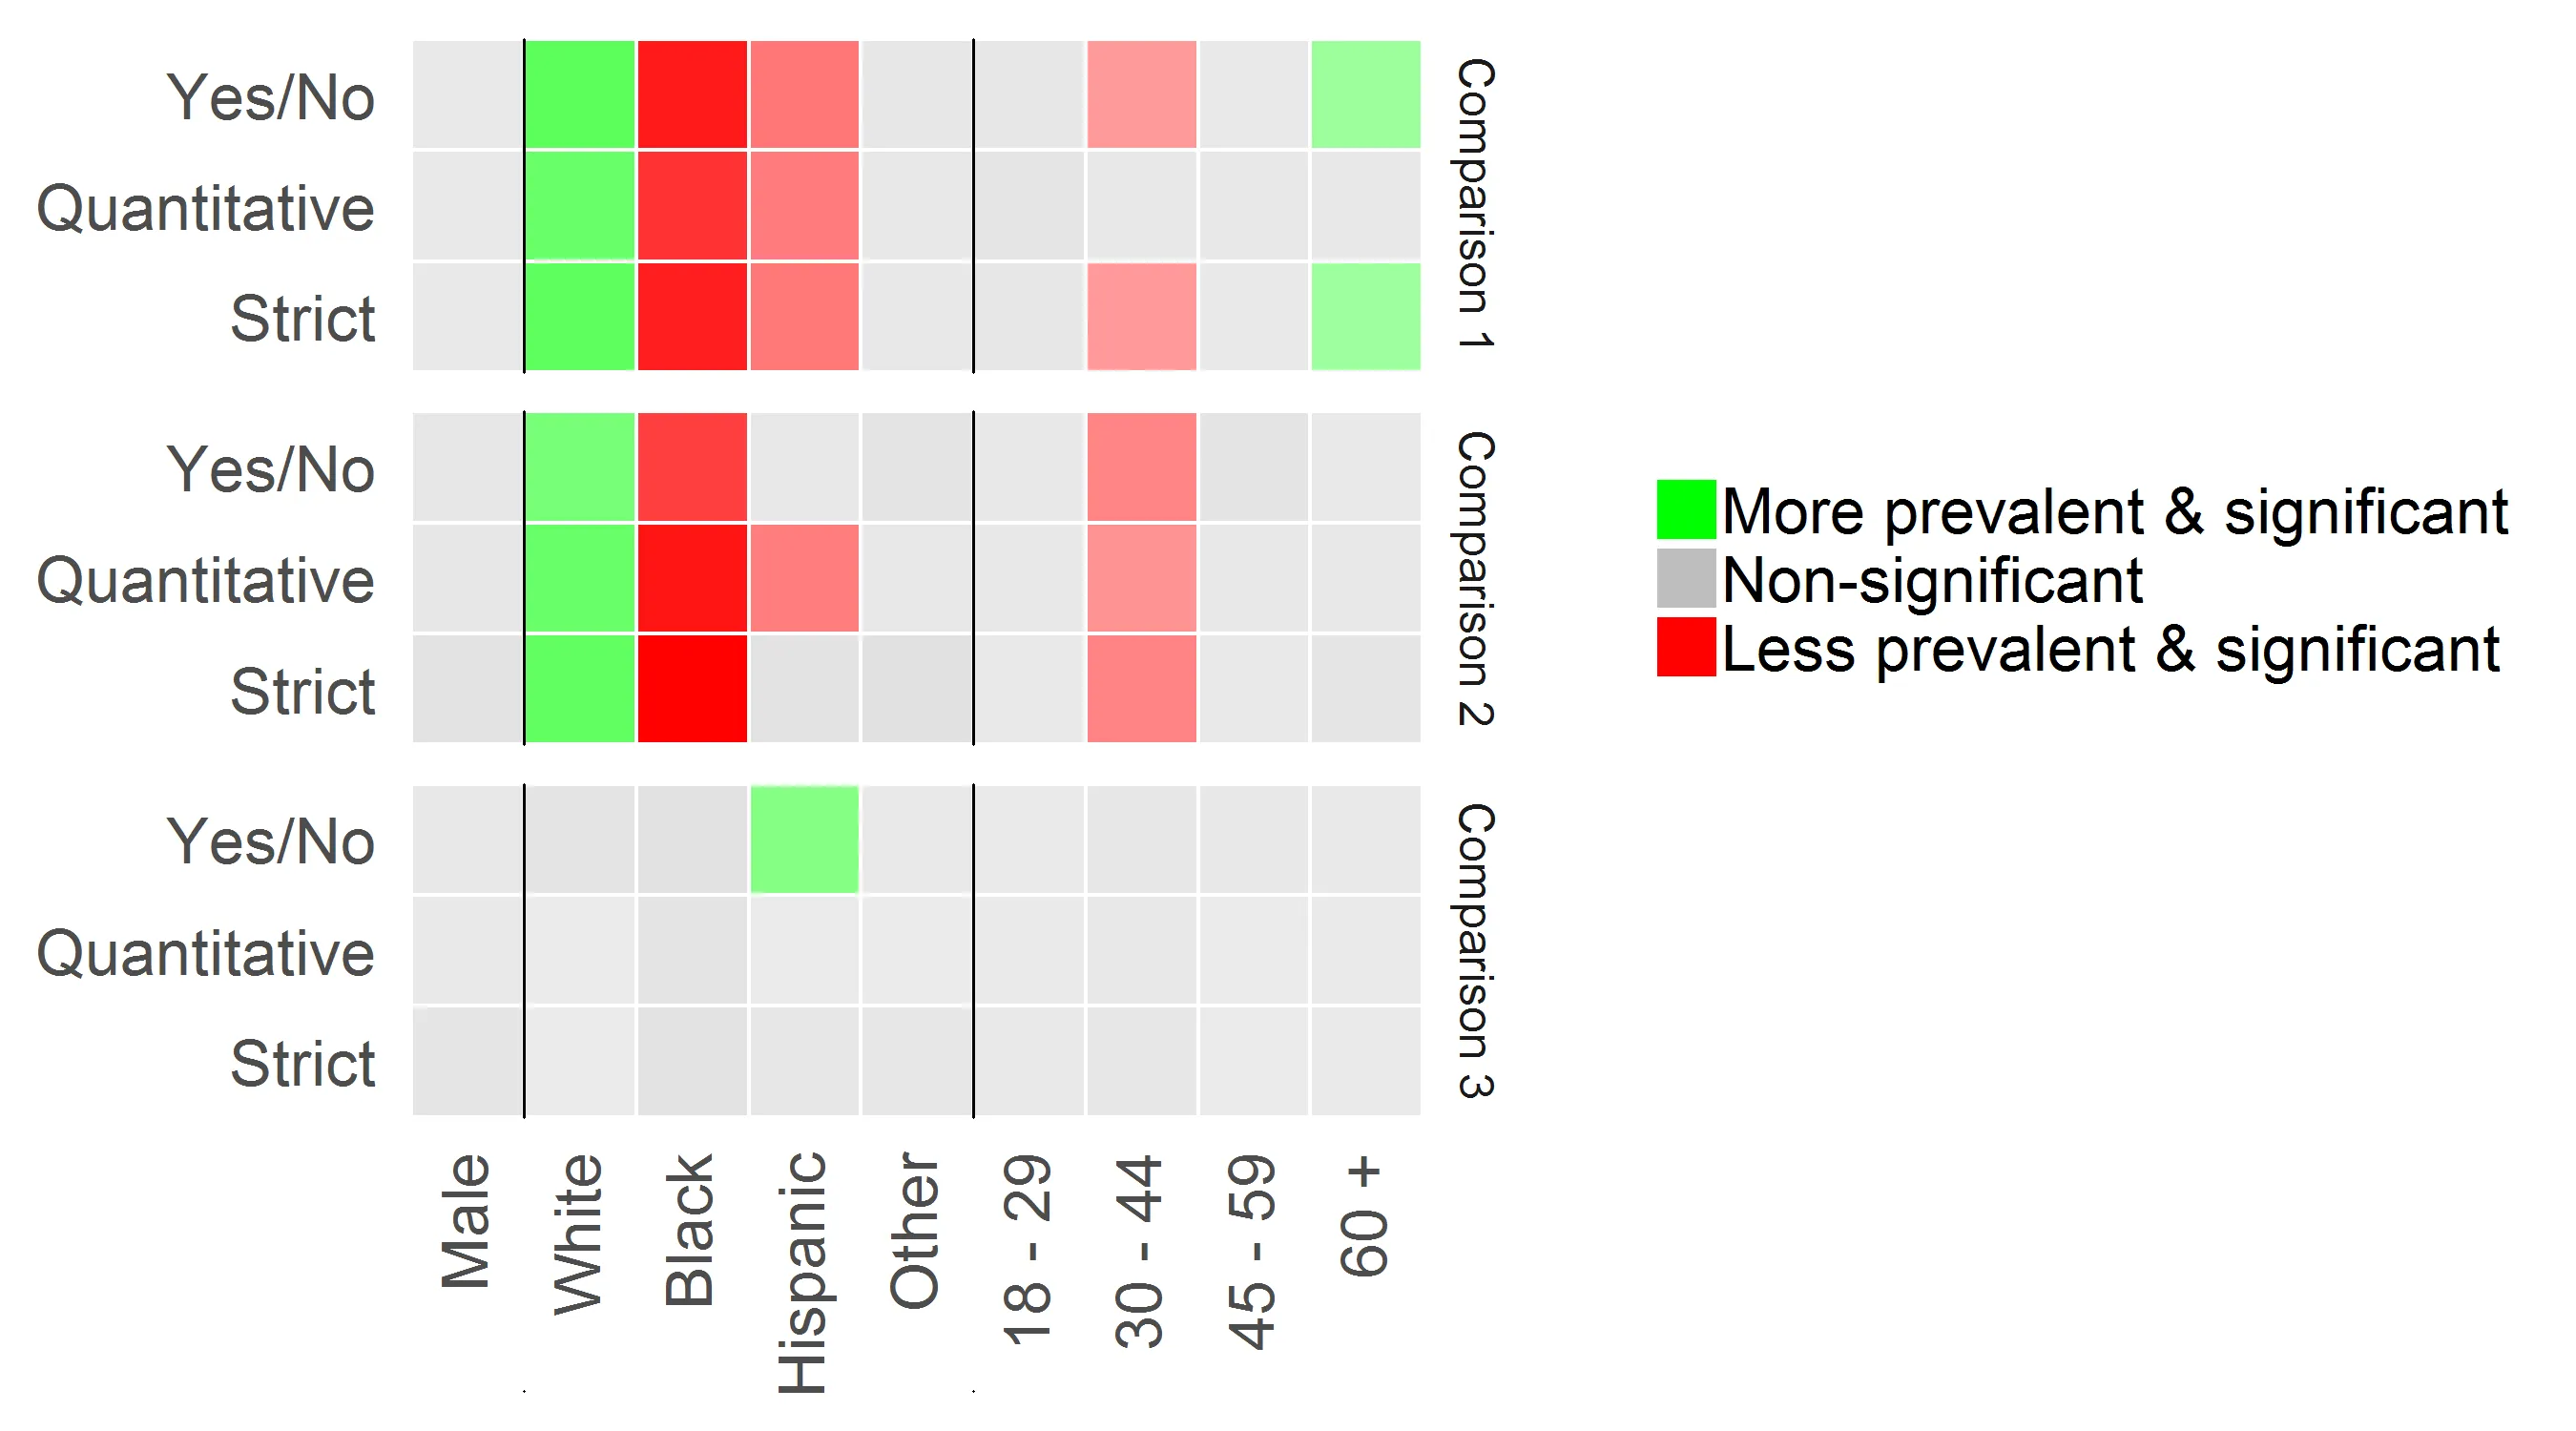
然而,当我使用内置的 ggplot2::geom_hline()(因为此图中的坐标轴是翻转的)时,我得到了下面的结果:
在查阅了之前的解决方案(例如这里和这里)后,我决定尝试使用 gtable 来修改绘图布局和/或使用 gtable_add_grob 添加额外的 grob。
我尝试使用 gtable_add_grob 结合 moveToGrob 和 lineToGrob 的组合(这里)或者 segmentsGrob (这里),但都未能解决我的问题。 moveToGrob 和 lineToGrob 似乎只适用于单个垂直线,而我想要多个;segmentsGrob 似乎只应用于单个绘图区域。
我现在很困惑,有人有什么建议吗?
数据
reprex <- data.frame(
     diff = c(1.31662094999948, 0.866821096444503, 1.51890736785243,
              2.38852458319537, 1.50276154671547, 1.58942354388551,
              0.579285478632874, 0.705737525937795, 0.820822837588395,
              0.803116467811481, 1.22496342202883, 0.65562485652129, 8.95737110367273,
              0.489705699642001, 18.291335204432, 1.32585187406239,
              0.423474055403873, 3.13089280711167, 0.642914242106793, 0.777062294322688,
              0.827365124783434, 1.79046662862126, 1.18259455819337,
              1.51401561610137, 0.328081138137496, 1.72740789953949,
              0.189926848328619, 1.45456392298709, 0.905411049427828, 1.60652327349693,
              1.81017750948238, 1.34335500622466, 1.34750494180214,
              0.722144243864773, 0.963665848513251, 0.749372041127016, 0.714812829735733,
              0.902315301989547, 0.792198501077858, 19.892119154905,
              1.75845439073389, 11.3122747224641, 2.74831540769519, 0.969397798638758,
              2.83507494194274, 0.658301650479607, 0.819696564064323,
              0.803104074531595, 1.34654008741793, 0.925244768606367,
              1.45533391066467, 0.24199160083309, 0.991764875430923, 0.244000979292541,
              1.19499450951635, 0.797225062653057, 1.49894247621815,
              2.41249071570669, 1.48095400287587, 1.62901123939155, 0.800939314874935,
              1.00449220172611, 0.797357424476374, 0.603543063256566,
              0.900713546848067, 0.670072150428499, 29.3000907867695,
              1.81141098721977, 16.1752860027313, 1.94316437225496, 0.650354223810153,
              2.98785538882299, 0.517693257397596, 0.606327251215883,
              0.853818224992284, 2.19310287140208, 1.50701879957261, 1.45525913281509,
              0.212947121365625, 1.0411346565884, 0.204533697940102),
       lb = c(0.492454940483492, 0.339355619743384, 0.957348434323997,
              1.26044791901582, 0.844261377268072, 1.09110321652908,
              0.322705783295933, 0.415474890828733, 0.583295860864908,
              0.451122506616931, 0.729128070092705, 0.467566913587157, 2.78767229589579,
              0.14257769192107, 9.50350595115945, 0.577593901163453,
              0.190917776501861, 1.84466415977226, 0.35956473247075,
              0.457078546874678, 0.599890772825811, 0.578883702093973, 0.402412042012875,
              0.820368078181714, 0.17260752641746, 0.927458567625053,
              0.131153965856016, 0.615148567644514, 0.407648792438177,
              0.932285544146073, 1.03364348457678, 0.826087466195112, 0.897205256605993,
              0.4275157755967, 0.612992386963926, 0.511383739399791,
              0.428874429875268, 0.583105952158013, 0.542148907801877, 4.43826058874205,
              0.372974670653646, 5.40020940786844, 1.14206113589909,
              0.422048214601624, 1.56677388916208, 0.397809279336784,
              0.528064920170086, 0.561512990408551, 0.458191509483684, 0.340370706390903,
              0.721212596438438, 0.125077100435655, 0.526945268441644,
              0.160890120433013, 0.361795965773801, 0.250825296360952,
              0.943872992434227, 1.15365773535204, 0.747771285996631, 1.12039094496198,
              0.409936729464542, 0.539876902216984, 0.567250295904343,
              0.313988141767326, 0.492823474852442, 0.479070611433729,
              3.90299786822159, 0.233618126135971, 8.62862044975527, 0.720592578735177,
              0.248713293467573, 1.77546875882829, 0.257921470181596,
              0.315074709151686, 0.619835605030249, 0.543099639646348,
              0.390664978249036, 0.792229860646373, 0.0958528256717599, 0.477302677009191,
              0.142069312041543),
       ub = c(3.52010018272045, 2.21413399256342, 2.40986406766882,
              4.52620818239219, 2.67487335923648, 2.31533292504986,
              1.03986876940221, 1.19878593510989, 1.15507442433696, 1.4297581065218,
              2.05798603408287, 0.919320721799612, 28.7818970712727,
              1.68197190619848, 35.2052121901469, 3.04345871452908,
              0.939306328022599, 5.31396987234459, 1.14955301612451, 1.32105480203952,
              1.14109614735927, 5.53784937563499, 3.47536788927362,
              2.7941644083463, 0.623595247760335, 3.21732760422109, 0.27503710986249,
              3.43942312042942, 2.01096920592577, 2.76837611018766,
              3.17008975021737, 2.18451767711803, 2.02380620801309, 1.21982003639318,
              1.51494845179116, 1.0981155886614, 1.191391572828, 1.39626923922028,
              1.1575758174161, 89.1557394076067, 8.2905411213909,
              23.6967772416461, 6.6136893575566, 2.22659890385437, 5.13006374565649,
              1.08936891504055, 1.27238608639718, 1.1486397742285,
              3.95723222603287, 2.51513384013216, 2.93671630527504, 0.468190697336216,
              1.86660290365135, 0.370044336690687, 3.94700884715508,
              2.53390630747049, 2.38043525455315, 5.04492040838695, 2.93301548174711,
              2.36852826238615, 1.5648848712587, 1.86895305056603,
              1.12080833973652, 1.16012097512602, 1.64619774599523, 0.937224442626833,
              219.957926982961, 14.0451848445645, 30.3223300635011,
              5.23997594345012, 1.70059513317832, 5.02812554719921, 1.03910042295524,
              1.16681131455086, 1.17612727538199, 8.85601803691856,
              5.81343552330794, 2.67318773103787, 0.473084399756679, 2.2710146524667,
              0.294462139584516),
     xmin = c(5, 5, 5, 6, 6, 6, 7, 7, 7, 8, 8, 8, 2, 2, 2, 3, 3, 3, 0, 0,
              0, 4, 4, 4, 1, 1, 1, 5, 5, 5, 6, 6, 6, 7, 7, 7, 8, 8, 8, 2,
              2, 2, 3, 3, 3, 0, 0, 0, 4, 4, 4, 1, 1, 1, 5, 5, 5, 6, 6, 6, 7,
              7, 7, 8, 8, 8, 2, 2, 2, 3, 3, 3, 0, 0, 0, 4, 4, 4, 1, 1, 1),
     xmax = c(6, 6, 6, 7, 7, 7, 8, 8, 8, 9, 9, 9, 3, 3, 3, 4, 4, 4, 1, 1,
              1, 5, 5, 5, 2, 2, 2, 6, 6, 6, 7, 7, 7, 8, 8, 8, 9, 9, 9, 3,
              3, 3, 4, 4, 4, 1, 1, 1, 5, 5, 5, 2, 2, 2, 6, 6, 6, 7, 7, 7, 8,
              8, 8, 9, 9, 9, 3, 3, 3, 4, 4, 4, 1, 1, 1, 5, 5, 5, 2, 2, 2),
     ymin = c(2, 2, 2, 2, 2, 2, 2, 2, 2, 2, 2, 2, 2, 2, 2, 2, 2, 2, 2, 2,
              2, 2, 2, 2, 2, 2, 2, 1, 1, 1, 1, 1, 1, 1, 1, 1, 1, 1, 1, 1,
              1, 1, 1, 1, 1, 1, 1, 1, 1, 1, 1, 1, 1, 1, 0, 0, 0, 0, 0, 0, 0,
              0, 0, 0, 0, 0, 0, 0, 0, 0, 0, 0, 0, 0, 0, 0, 0, 0, 0, 0, 0),
     ymax = c(3, 3, 3, 3, 3, 3, 3, 3, 3, 3, 3, 3, 3, 3, 3, 3, 3, 3, 3, 3,
              3, 3, 3, 3, 3, 3, 3, 2, 2, 2, 2, 2, 2, 2, 2, 2, 2, 2, 2, 2,
              2, 2, 2, 2, 2, 2, 2, 2, 2, 2, 2, 2, 2, 2, 1, 1, 1, 1, 1, 1, 1,
              1, 1, 1, 1, 1, 1, 1, 1, 1, 1, 1, 1, 1, 1, 1, 1, 1, 1, 1, 1),
      var = as.factor(c("18 - 29", "18 - 29", "18 - 29", "30 - 44",
                        "30 - 44", "30 - 44", "45 - 59", "45 - 59",
                        "45 - 59", "60 +", "60 +", "60 +", "Black", "Black",
                        "Black", "Hispanic", "Hispanic", "Hispanic", "Male", "Male",
                        "Male", "Other", "Other", "Other", "White", "White",
                        "White", "18 - 29", "18 - 29", "18 - 29", "30 - 44",
                        "30 - 44", "30 - 44", "45 - 59", "45 - 59",
                        "45 - 59", "60 +", "60 +", "60 +", "Black", "Black", "Black",
                        "Hispanic", "Hispanic", "Hispanic", "Male", "Male",
                        "Male", "Other", "Other", "Other", "White", "White",
                        "White")),
   comparison = as.factor(c("Comparison 2", "Comparison 3", "Comparison 1",
                        "Comparison 2", "Comparison 3", "Comparison 1",
                        "Comparison 2", "Comparison 3", "Comparison 1",
                        "Comparison 2", "Comparison 3", "Comparison 1",
                        "Comparison 2", "Comparison 3", "Comparison 1", "Comparison 2",
                        "Comparison 3", "Comparison 1", "Comparison 2",
                        "Comparison 3", "Comparison 1", "Comparison 2",
                        "Comparison 3", "Comparison 1", "Comparison 2", "Comparison 3",
                        "Comparison 1", "Comparison 2", "Comparison 3",
                        "Comparison 1", "Comparison 2", "Comparison 3",
                        "Comparison 1", "Comparison 2", "Comparison 3", "Comparison 1",
                        "Comparison 2", "Comparison 3", "Comparison 1",
                        "Comparison 2", "Comparison 3", "Comparison 1",
                        "Comparison 2", "Comparison 3", "Comparison 1", "Comparison 2",
                        "Comparison 3", "Comparison 1", "Comparison 2",
                        "Comparison 3", "Comparison 1", "Comparison 2",
                        "Comparison 3", "Comparison 1", "Comparison 2",
                        "Comparison 3", "Comparison 1", "Comparison 2", "Comparison 3",
                        "Comparison 1", "Comparison 2", "Comparison 3",
                        "Comparison 1", "Comparison 2", "Comparison 3",
                        "Comparison 1", "Comparison 2", "Comparison 3", "Comparison 1",
                        "Comparison 2", "Comparison 3", "Comparison 1",
                        "Comparison 2", "Comparison 3", "Comparison 1",
                        "Comparison 2", "Comparison 3", "Comparison 1", "Comparison 2",
                        "Comparison 3", "Comparison 1")),
      sig = as.factor(c("Non-significant", "Non-significant",
                        "Non-significant", "Less prevalent & significant",
                        "Non-significant", "Less prevalent & significant",
                        "Non-significant", "Non-significant",
                        "Non-significant", "Non-significant", "Non-significant",
                        "More prevalent & significant", "Less prevalent & significant",
                        "Non-significant", "Less prevalent & significant",
                        "Non-significant", "More prevalent & significant",
                        "Less prevalent & significant", "Non-significant",
                        "Non-significant", "Non-significant", "Non-significant",
                        "Non-significant", "Non-significant",
                        "More prevalent & significant", "Non-significant",
                        "More prevalent & significant", "Non-significant", "Non-significant",
                        "Non-significant", "Less prevalent & significant",
                        "Non-significant", "Non-significant", "Non-significant",
                        "Non-significant", "Non-significant",
                        "Non-significant", "Non-significant", "Non-significant",
                        "Less prevalent & significant", "Non-significant",
                        "Less prevalent & significant", "Less prevalent & significant",
                        "Non-significant", "Less prevalent & significant",
                        "Non-significant", "Non-significant", "Non-significant",
                        "Non-significant", "Non-significant",
                        "Non-significant", "More prevalent & significant", "Non-significant",
                        "More prevalent & significant", "Non-significant",
                        "Non-significant", "Non-significant",
                        "Less prevalent & significant", "Non-significant",
                        "Less prevalent & significant", "Non-significant", "Non-significant",
                        "Non-significant", "Non-significant",
                        "Non-significant", "More prevalent & significant",
                        "Less prevalent & significant", "Non-significant",
                        "Less prevalent & significant", "Non-significant", "Non-significant",
                        "Less prevalent & significant", "Non-significant",
                        "Non-significant", "Non-significant", "Non-significant",
                        "Non-significant", "Non-significant",
                        "More prevalent & significant", "Non-significant",
                        "More prevalent & significant")),
   sample = as.factor(c("Yes/No", "Yes/No", "Yes/No", "Yes/No", "Yes/No",
                        "Yes/No", "Yes/No", "Yes/No", "Yes/No", "Yes/No",
                        "Yes/No", "Yes/No", "Yes/No", "Yes/No", "Yes/No",
                        "Yes/No", "Yes/No", "Yes/No", "Yes/No", "Yes/No",
                        "Yes/No", "Yes/No", "Yes/No", "Yes/No", "Yes/No", "Yes/No",
                        "Yes/No", "Quantitative", "Quantitative",
                        "Quantitative", "Quantitative", "Quantitative", "Quantitative",
                        "Quantitative", "Quantitative", "Quantitative",
                        "Quantitative", "Quantitative", "Quantitative",
                        "Quantitative", "Quantitative", "Quantitative", "Quantitative",
                        "Quantitative", "Quantitative", "Quantitative",
                        "Quantitative", "Quantitative", "Quantitative",
                        "Quantitative", "Quantitative", "Quantitative",
                        "Quantitative", "Quantitative", "Strict", "Strict", "Strict",
                        "Strict", "Strict", "Strict", "Strict", "Strict",
                        "Strict", "Strict", "Strict", "Strict", "Strict", "Strict",
                        "Strict", "Strict", "Strict", "Strict", "Strict",
                        "Strict", "Strict", "Strict", "Strict", "Strict",
                        "Strict", "Strict", "Strict")))
基础ggplot
p <- ggplot(reprex, aes(xmin=xmin, xmax=xmax, ymin=ymin, ymax=ymax)) +
  geom_rect(color="white", aes(fill=sig, alpha=abs(log(diff)))) +
  scale_fill_manual(values=c("green", "grey", "red")) +
  scale_x_continuous(breaks=1:length(levels(plot_dat$var)) - .75, labels=levels(plot_dat$var), expand=c(0, 0)) +
  scale_y_continuous(breaks=1:length(levels(plot_dat$sample)) - .5, labels=levels(plot_dat$sample), expand=c(0, .0)) +
  facet_grid(rows=vars(comparison)) +
  theme_minimal(base_size=20) +
  theme(panel.grid=element_blank(), legend.title=element_blank(), axis.text.x=element_text(angle=90, hjust=1), strip.text=element_text(size=12))
SEGMENTSGROB 尝试
gb <- ggplot_build(p)
g <- ggplot_gtable(gb)

xs <- c(1, 5)/length(unique(reprex$var))

g <- gtable_add_grob(g,
                     list(segmentsGrob(x0=xs, x1=xs, y0=0, y1=1),
                          segmentsGrob(x0=xs, x1=xs, y0=0, y1=1),
                          segmentsGrob(x0=xs, x1=xs, y0=0, y1=1),
                          segmentsGrob(x0=xs, x1=xs, y0=0, y1=1)),
                     clip="off", t=c(7, 9, 11, 14), l=5)

grid.newpage()
grid.draw(g)
移动到格罗布和连接到格罗布尝试
gb <- ggplot_build(p)
g <- ggplot_gtable(gb)

xs <- c(1, 5)/length(unique(reprex$var))

for(i in xs) {
  g <- gtable_add_grob(g, moveToGrob(i, 1), clip="off", t=7, l=5)
  g <- gtable_add_grob(g, lineToGrob(i, 0), clip="off", t=14, l=5)
}

grid.newpage()
grid.draw(g)
gtable_add_grob()下的“clip”参数是什么意思吗? - Patrick S. Forscher