ggplot2添加跨越面板边缘的注释

10

我想要在ggplot中绘制一个矩形标注,它将跨越facet边界。

library(ggplot2)
myPlot <- ggplot(mpg, aes(displ, hwy)) + 
    geom_point() + 
    facet_grid(class ~ .)

# add annotation
myPlot +
  annotate("rect", xmin = 3, xmax = 4, ymin = -Inf, ymax = Inf, fill = "green", alpha = 1/5)

目前我已经做了什么:

目前为止已完成的

我想绘制一个跨越面板边缘的大矩形,如下所示:

我想要的杂乱的画图编辑

是否有一种内置的ggplot2代码或者ggforce可以实现这个效果,或者我必须通过grid来解决?我的理想情况仍然允许我拥有myPlot作为ggplot对象,这就是为什么在此之前我避免使用任何复杂的网格内容。


1
你尝试过这种方法吗? - Dan
2
这个问题值得被点赞,因为您提供了预期的行为。 - Ṃųỻịgǻňạcểơửṩ
@Lyngbakr,感谢提供链接,不知何故我的谷歌搜索没有找到这些。我现在正在尝试使用该策略,但是在将其适应于ggplot 2.2.1时遇到了一些困难(似乎新的ggplot版本和这种方法很常见)。如果我找到解决方案,我会更新的。 - user131291
1个回答

3

一种使用grid函数编辑您的plot的方法。

grid视口中绘制一个矩形很容易。是否可能构造一个grid视口,使其完全覆盖ggplot面板集?答案是“是”。对于绘制矩形的技巧是从ggplot_build信息中获取x轴“本地”坐标到grid视口中。

library(ggplot2)
library(grid)

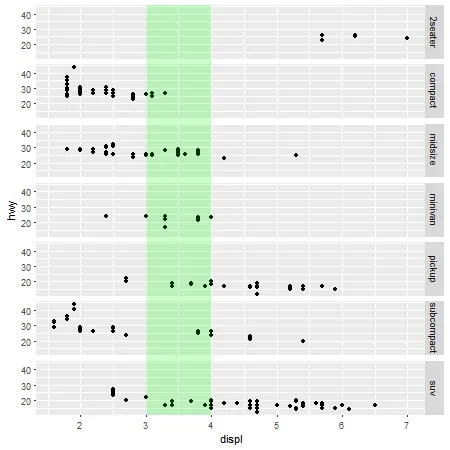
plot <- ggplot(mpg, aes(displ, hwy)) + 
    geom_point() + 
    facet_grid(class ~ .) 

plot

# Construct a grid.layout that is the same as the ggplot layout
gt = ggplotGrob(plot)
lay = grid.layout(nrow = length(gt$heights), ncol = length(gt$widths),
                  widths = gt$widths, heights = gt$heights)

# Push to this viewport
pushViewport(viewport(layout = lay))

# Within the layout, push to a viewport that spans the plot panels.
pos = gt$layout[grep("panel", gt$layout$name), c("t", "l")]  # Positions of the panels
pushViewport(viewport(layout.pos.col = pos$l, layout.pos.row = min(pos$t):max(pos$t)))

# Get the limits of the ggplot's x-scale, including any expansion.
## For ggplot ver 2.2.1
# x.axis.limits = ggplot_build(plot)$layout$panel_ranges[[1]][["x.range"]]

## For ver 3.0.0
# axis.limits = ggplot_build(plot)$layout$panel_params[[1]]$x.range
# But possibly the following will be more immune to future changes to ggplot
x.axis.limits = summarise_layout(ggplot_build(plot))[1, c('xmin', 'xmax')]


# Set up a data viewport,
# so that the x-axis units are, in effect, "native", 
# but y-axis units are, in effect, "npc".
# And push to the data viewport.
pushViewport(dataViewport(yscale = c(0, 1), 
                          xscale = x.axis.limits))

# Draw the rectangle
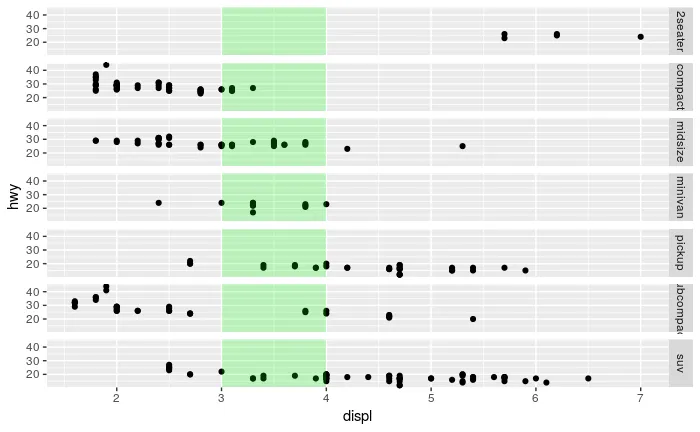
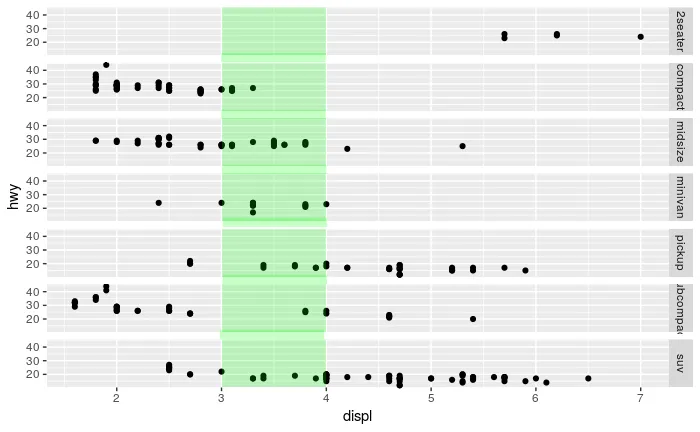
grid.rect(x = 3, y = 0,
          width = 1, height = 1,
          just = c("left", "bottom"), default.units = "native",
          gp = gpar(fill = "green", col = "transparent", alpha = .2))

# Back to the root viewport
upViewport(0)

enter image description here


这个很好用!谢谢。只需要进行一些小修改,以更新到ggplot v 2.2.1(来自此代码片段,请参见2018年6月20日的“stefanedwards”评论)。 - user131291
实际上,这个解决方案存在一个小问题,即似乎没有考虑到轴填充或其他因素,因为矩形并没有精确地定位在目标坐标处。 - user131291
@user131291 我使用的是 ggplot2 版本 2.2.1,原始响应正常工作。我正在撤销编辑,但添加了一个更新,以适应即将发布的 ggplot 版本 2.3.0。顺便说一句,在您的编辑中选择 x 轴范围的方法(选择 layout$panel_scales_x)不允许在 x 轴上进行扩展。 - Sandy Muspratt

网页内容由stack overflow 提供, 点击上面的
可以查看英文原文,
原文链接