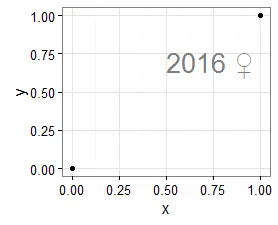
我试图在我的绘图中使用女性符号,♀。它看起来很淡(至少在我的实际图表上是这样),所以我希望能够将其加粗。
df <- data.frame(x = c(0, 1), y = c(0, 1))
ggplot(df, aes(x, y)) + geom_point() +
   theme_bw() +
   annotate("text", x = 0.5, y = 0.7, label = "2016 ♀",
   size = 7, hjust = 0, colour = "grey50")
我尝试了以下方法,但似乎都不起作用:
ggplot(df, aes(x, y)) + geom_point() +
   annotate("text", x = 0.5, y = 0.7, label = "2016~bold(♀)",
   size = 7, hjust = 0, parse = TRUE)

# error message: Error in parse(text = as.character(lab)) : <text>:1:11: unexpected '<'
#1: 2016~bold(<
              ^

ggplot(df, aes(x, y)) + geom_point() +
   annotate("text", x = 0.5, y = 0.7, label = "2016~bold(u2640)",
   size = 7, hjust = 0, parse = TRUE)

ggplot(df, aes(x, y)) + geom_point() +
   annotate("text", x = 0.5, y = 0.7, label = "2016~bold(\u2640)",
   size = 7, hjust = 0, parse = TRUE)
我还发现了这篇帖子,但我不确定是否能修改以下代码以在ggplot中使用?
plot(df)
text( locator(1), "\\VE", vfont=c("sans serif","bold"), xpd=TRUE)  # Venus
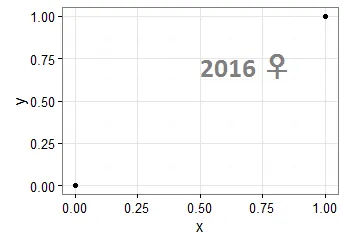
annotate调用中添加fontface = 'bold',然后2016将会加粗显示,但是♀在我的屏幕上看起来一样。我猜测这个字体可能没有该字符的加粗表示? - Axeman