我正在使用R中的ggplot2库。
假设我有一个看起来像这样的图表:
假设我有一个看起来像这样的图表:
library(ggplot2)
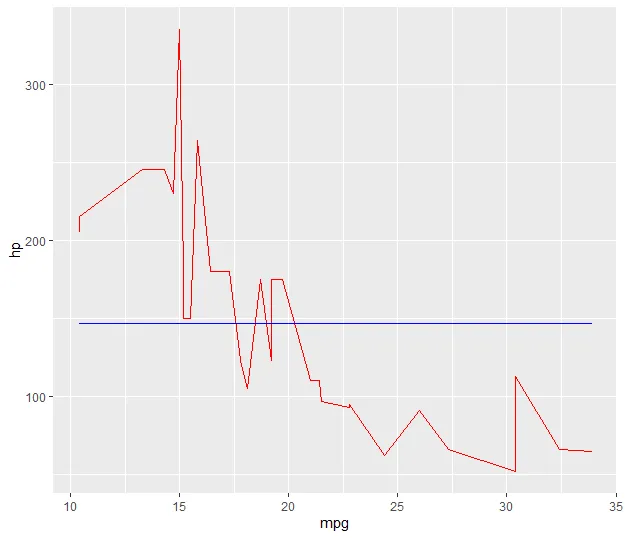
ggplot(work) + geom_line(aes(x = var1, y = var2, group = 1)) +
theme(axis.text.x = element_text(angle = 90)) +
ggtitle("sample graph")
有没有一种方法可以直接向这个图表添加第二条线?
例如:
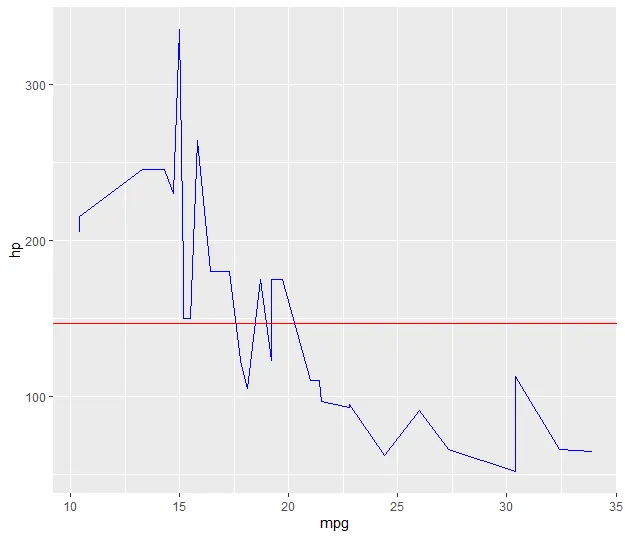
ggplot(work) + geom_line(aes(x = var1, y = var2, group = 1)) +
               geom_line(aes(x = var1, y = mean(var2), group = 1)) +
               theme(axis.text.x = element_text(angle = 90)) +
               ggtitle("Sample graph")
谢谢
)- 看起来在上面的编辑后它似乎可以工作。如@Ronak Shah所建议的,如果它仍然不能按照你的期望工作,请提供最小可重现示例(MRE)。 - Waldi