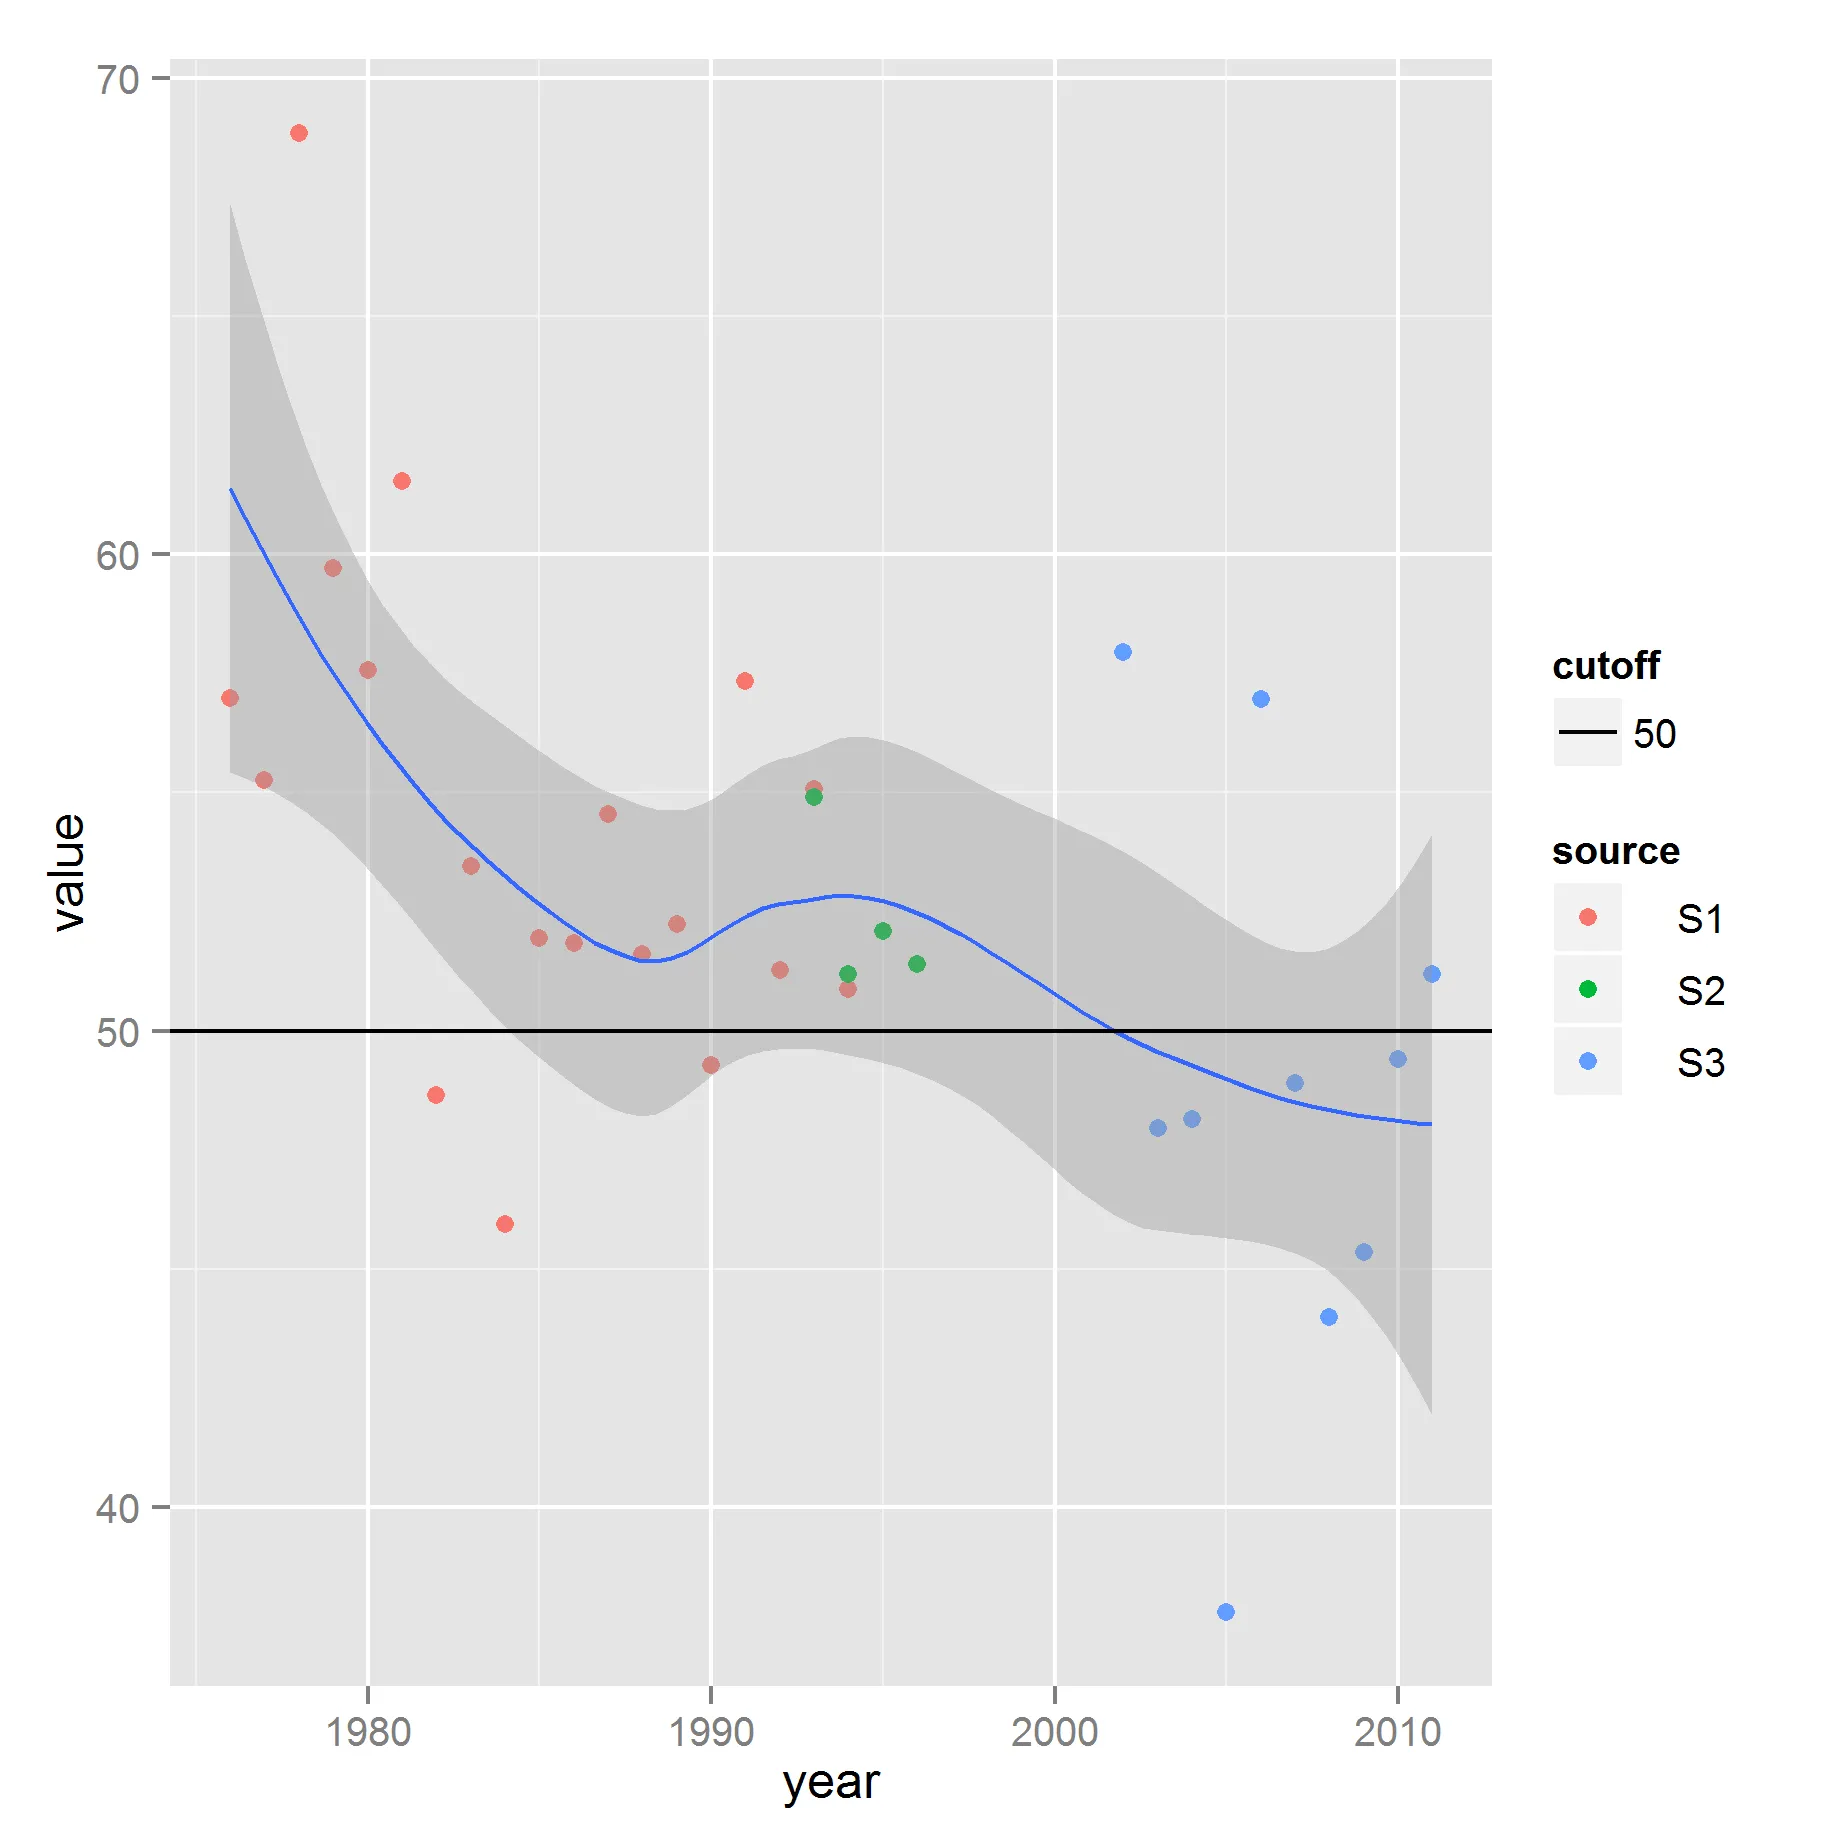
这段代码生成了一个漂亮的图,但我想在y=50处添加一条黑色水平线,并使图例显示一条带有文本“cutoff”的黑色线条,但保留源数据的点。我可以使用geom_line添加线条,但无法将线条添加到图例中。
    library(ggplot2)
    the.data <- read.table( header=TRUE, sep=",",
    text="source,year,value
    S1,1976,56.98
    S1,1977,55.26
    S1,1978,68.83
    S1,1979,59.70
    S1,1980,57.58
    S1,1981,61.54
    S1,1982,48.65
    S1,1983,53.45
    S1,1984,45.95
    S1,1985,51.95
    S1,1986,51.85
    S1,1987,54.55
    S1,1988,51.61
    S1,1989,52.24
    S1,1990,49.28
    S1,1991,57.33
    S1,1992,51.28
    S1,1993,55.07
    S1,1994,50.88
    S2,1993,54.90
    S2,1994,51.20
    S2,1995,52.10
    S2,1996,51.40
    S3,2002,57.95
    S3,2003,47.95
    S3,2004,48.15
    S3,2005,37.80
    S3,2006,56.96
    S3,2007,48.91
    S3,2008,44.00
    S3,2009,45.35
    S3,2010,49.40
    S3,2011,51.19")
    ggplot(the.data, aes( x = year, y = value ) ) +
        geom_point(aes(colour = source)) +
        geom_smooth(aes(group = 1))
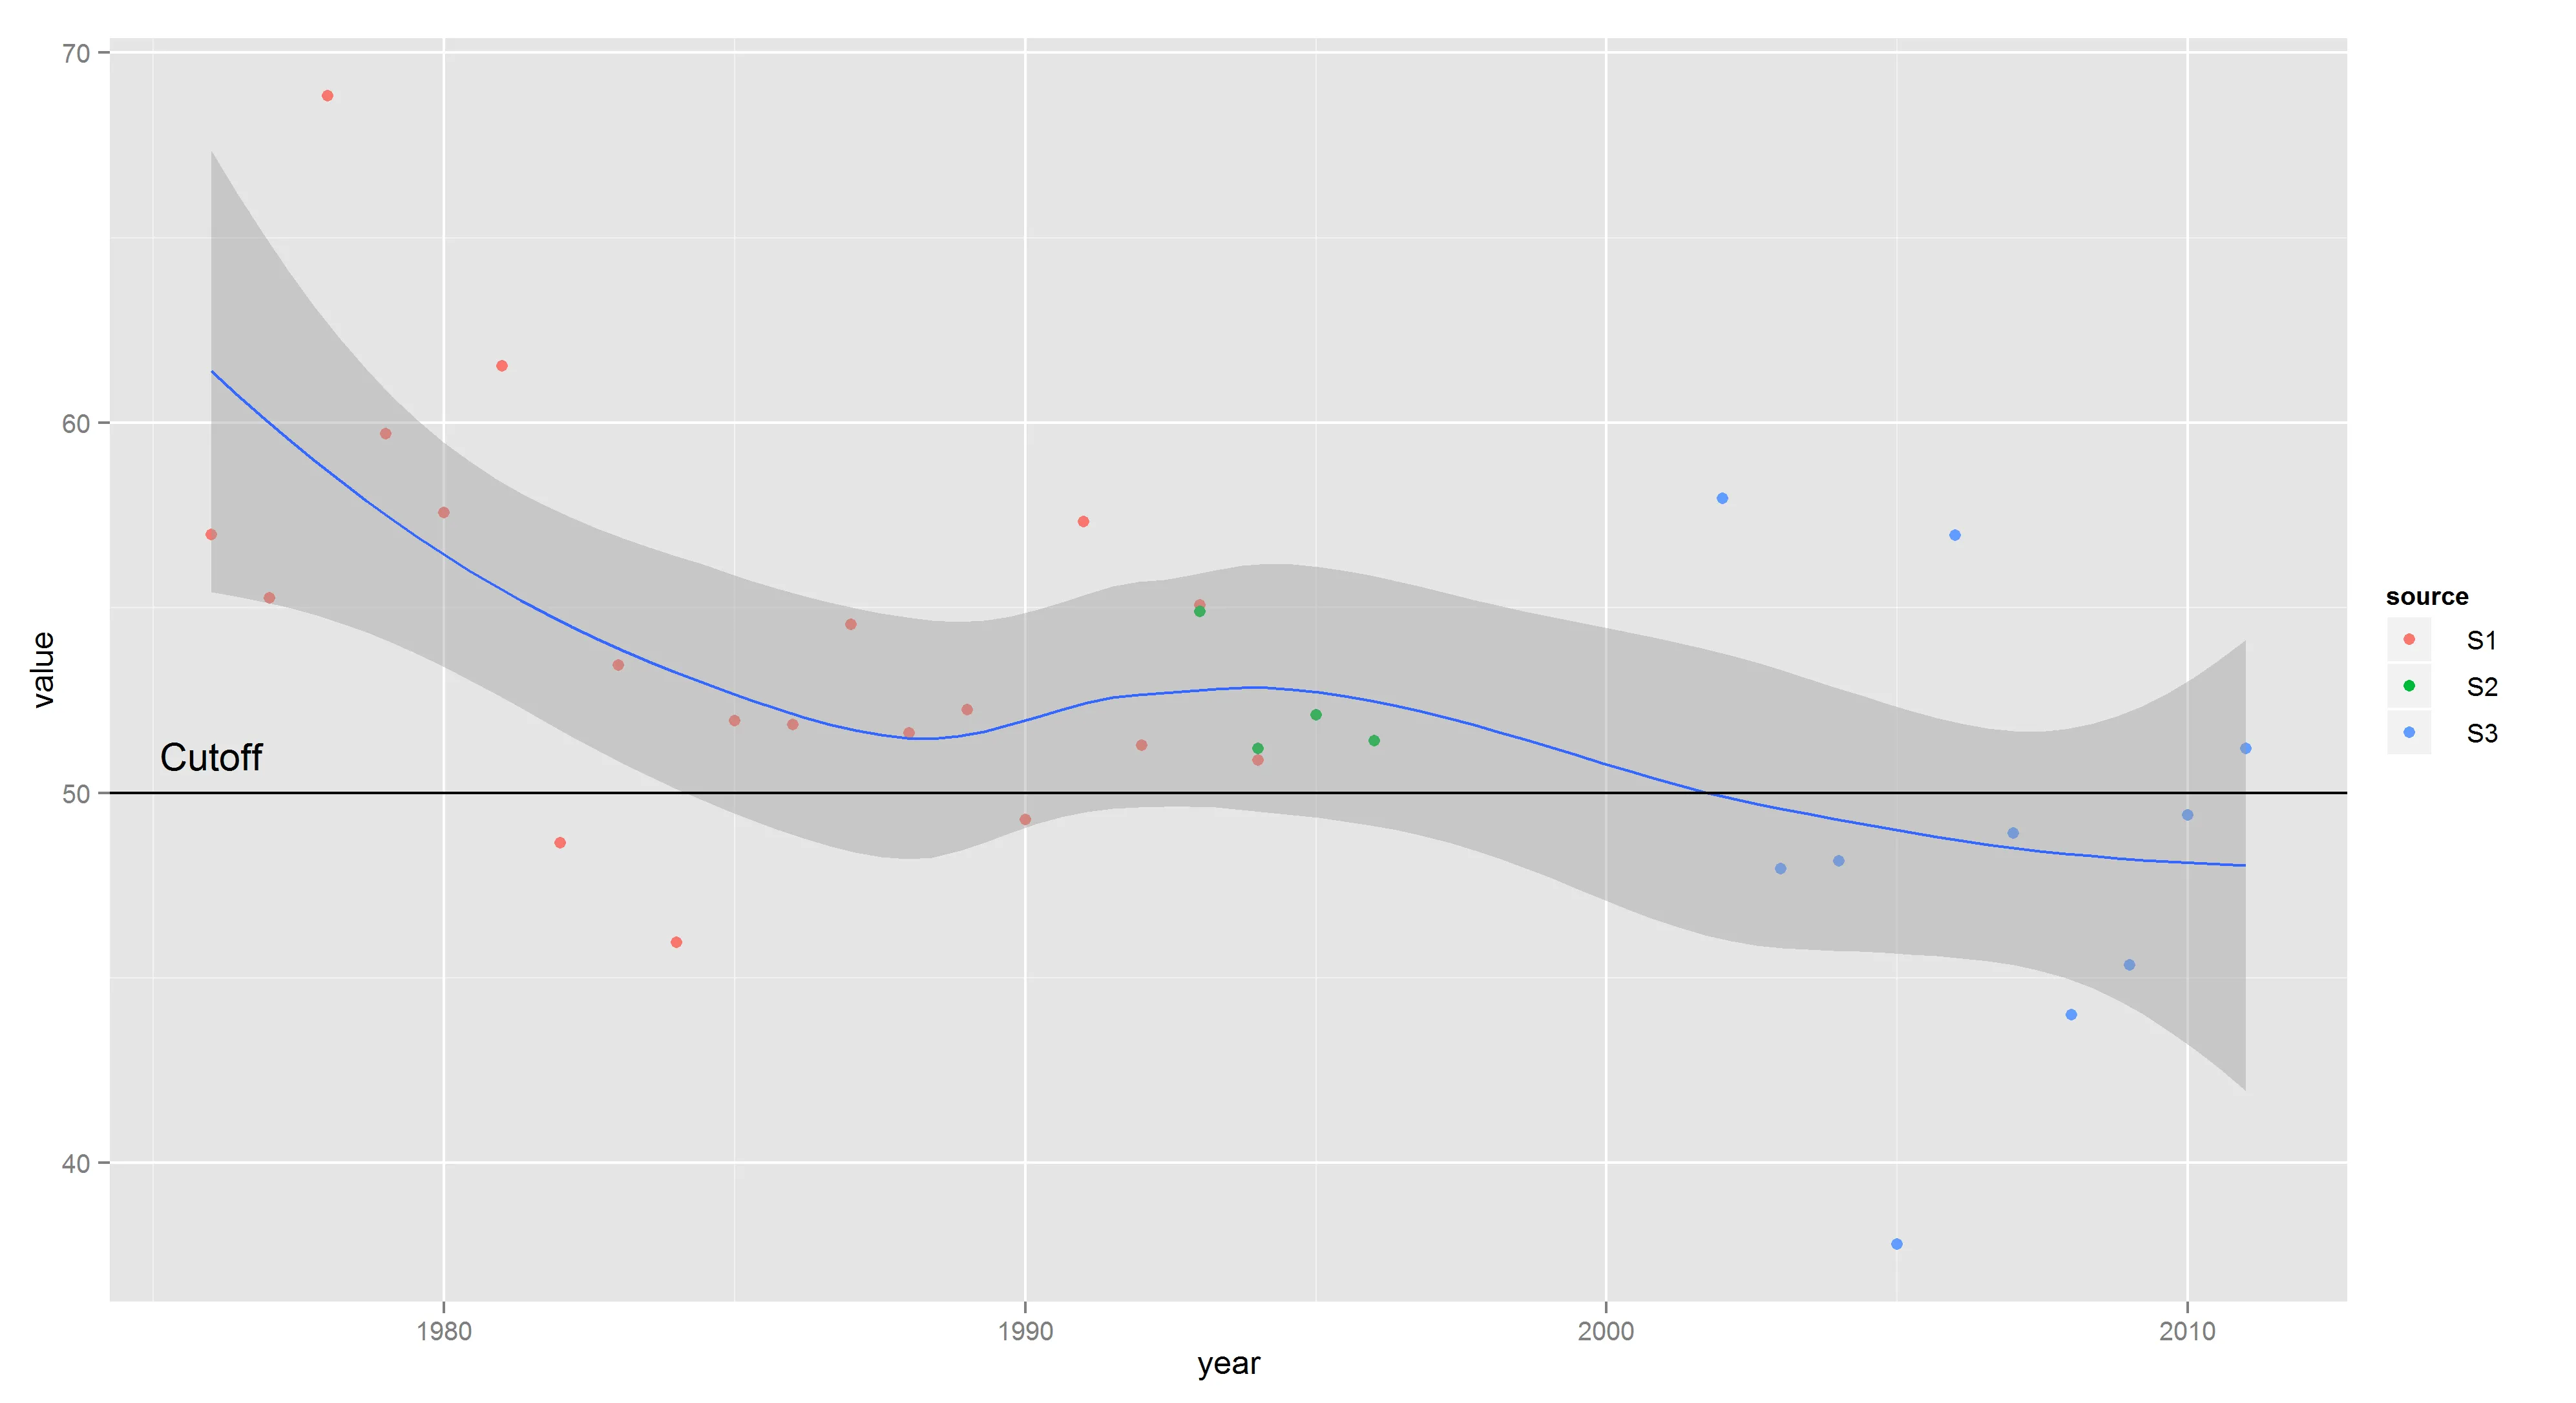
geom_text中可以指定fontface=和family=。请参见?geom_text底部的示例。 - G. Grothendieck