我想通过在中位数处添加一个粗条来使ggplot2箱线图更有意义(这样,如果中位数等于下四分位数或上四分位数中的任何一个,就可以检测到它等于哪一个)。我看到了Kohske最近的一篇文章:
Can I get boxplot notches in ggplot2?
但我不知道如何给“交叉条”添加“高度”。然后我试着用一个矩形,但也没有成功。这是一个最简示例:
require(ggplot2)
require(reshape2)
require(plyr)
set.seed(1)
## parameters
p1 <- c(5, 20, 100)
p2 <- c("f1", "f2", "f3", "f4", "f5")
p3 <- c("g1","g2","g3","g4","g5")
N <- 1000
## lengths
l1 <- length(p1)
l2 <- length(p2)
l3 <- length(p3)
## build result array containing the measurements
arr <- array(rep(NA, l1*l2*l3*N), dim=c(l1, l2, l3, N),
dimnames=list(
p1=p1,
p2=p2,
p3=p3,
N=1:N))
for(i in 1:l1){
for(j in 1:l2){
for(k in 1:l3){
arr[i,j,k,] <- i+j+k+runif(N, min=-4, max=4)
}
}
}
arr <- arr + rexp(3*5*5*N)
## create molten data
mdf <- melt(arr, formula = . ~ p1 + p2 + p3 + N) # create molten data frame
## confidence interval calculated by `boxplot.stats`
f <- function(x){
ans <- boxplot.stats(x)
data.frame(x=x, y=ans$stats[3], ymin=ans$conf[1], ymax=ans$conf[2])
}
## (my poor) trial
ggplot(mdf, aes(x=p3, y=value)) + geom_boxplot(outlier.shape=1) +
stat_summary(fun.data=f, geom="rectangle", colour=NA, fill="black",
xmin=x-0.36, xmax=x+0.36, ymin=max(y-0.2, ymin), ymax=min(y+0.2,
ymax)) + facet_grid(p2 ~ p1, scales = "free_y")
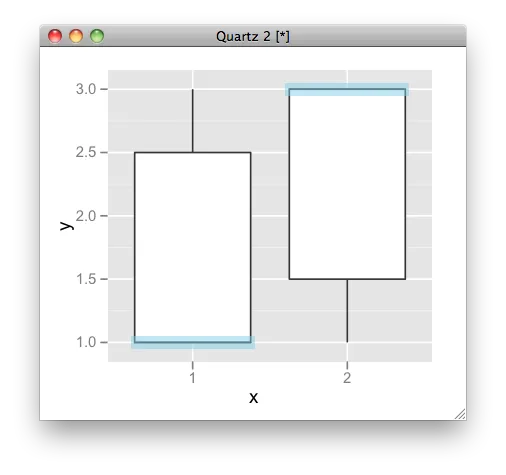
**SOLUTION** (after the discussion with Kohske below):
f <- function(x, height){
ans <- median(x)
data.frame(y=ans, ymin=ans-height/2, ymax=ans+height/2)
}
p <- ggplot(mdf, aes(x=p3, y=value)) + geom_boxplot(outlier.shape=1) +
stat_summary(fun.data=f, geom="crossbar", height=0.5, colour=NA,
fill="black", width=0.78) +
facet_grid(p2 ~ p1, scales = "free_y")
pdf()
print(p)
dev.off()
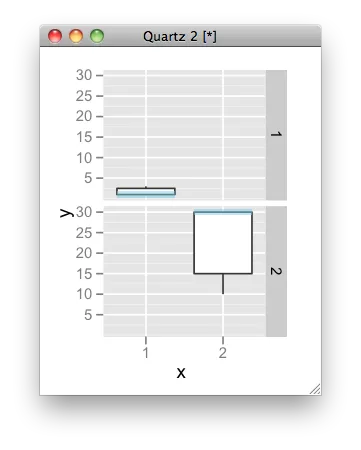
**UPDATE** Hmmm... it's not that trivial. The following example shows that the "height" of the crossbar should be adapted to the y-axis scale, otherwise it might be overseen.
require(ggplot2)
require(reshape2)
require(plyr)
set.seed(1)
## parameters
p1 <- c(5, 20, 100)
p2 <- c("f1", "f2", "f3", "f4", "f5")
p3 <- c("g1","g2","g3","g4","g5")
N <- 1000
## lengths
l1 <- length(p1)
l2 <- length(p2)
l3 <- length(p3)
## build result array containing the measurements
arr <- array(rep(NA, l1*l2*l3*N), dim=c(l1, l2, l3, N),
dimnames=list(
p1=p1,
p2=p2,
p3=p3,
N=1:N))
for(i in 1:l1){
for(j in 1:l2){
for(k in 1:l3){
arr[i,j,k,] <- i+j^4+k+runif(N, min=-4, max=4)
}
}
}
arr <- arr + rexp(3*5*5*N)
arr[1,2,5,] <- arr[1,2,5,]+30
arr[1,5,3,] <- arr[1,5,3,]+100
## create molten data
mdf <- melt(arr, formula = . ~ p1 + p2 + p3 + N) # create molten data frame
f <- function(x, height){
ans <- median(x)
data.frame(y=ans, ymin=ans-height/2, ymax=ans+height/2)
}
## plot
p <- ggplot(mdf, aes(x=p3, y=value)) + geom_boxplot(outlier.shape=1) +
stat_summary(fun.data=f, geom="crossbar", height=0.7, colour=NA,
fill="black", width=0.78) +
facet_grid(p2 ~ p1, scales = "free_y")
pdf()
print(p)
dev.off()
x的值找不到。 - Andrieboxplot(count ~ spray, data = InsectSprays)(这是?boxplot中的第一个示例)来完全理解我的意思。您可以清楚地看到,中位数由比下四分位数和上四分位数更粗的水平线表示(或者整个箱子,如果您愿意)。如果您查看组“D”,则会发现在这种情况下,中位数等于上四分位数。如果中位数没有更粗的线,则无法将其与中位数等于下四分位数的情况区分开来。 - Marius Hofert