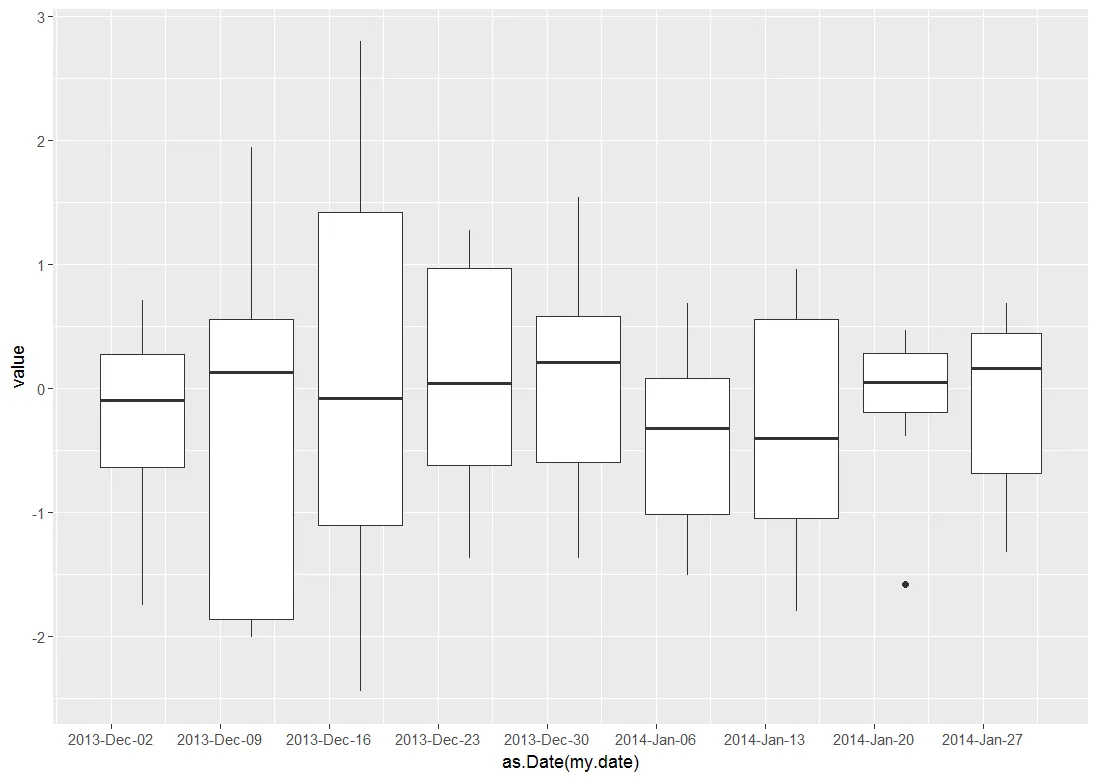
这段代码生成一个箱线图:
df <- data.frame(value = rnorm(62), my.date = seq(as.Date("2013-12-01"), as.Date("2014-01-31"), by="1 day"))

library(ggplot2)
ggplot(df, aes(as.Date(my.date), value)) + geom_boxplot() + scale_x_date(minor_breaks = "1 week", labels = date_format("%W\n%b"))
如何绘制一个仅包含12月1日至1月31日之间每周的单个箱线图的图表?在这个单个图中,应该有大约8个箱线图。希望使用
ggplot()或scale_x_date()来解决。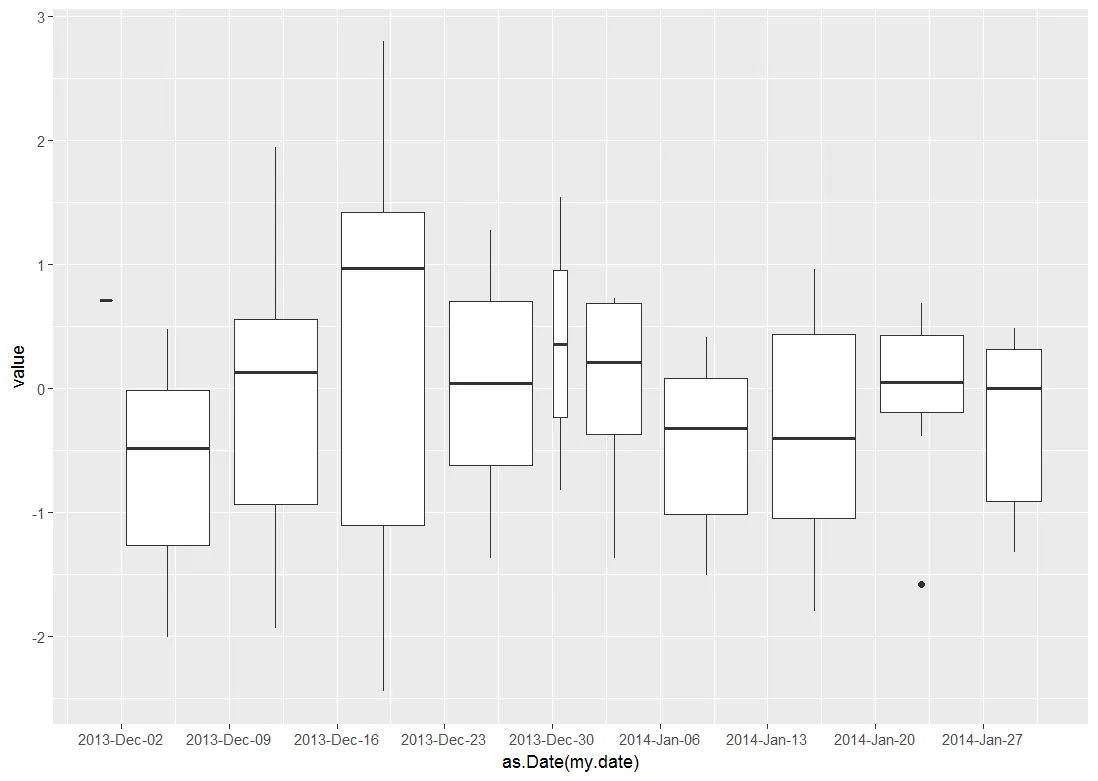
scale_x_date内部难道没有实现这个的方法吗? - lucianodf$weeks <- format(df$my.date, "%Y/%W")- Matt Wellerscale_x_date的功能,例如minor_breaks。有没有人有一个解决方案,不必诉诸于使用reorder、scale_x_discrete或factor? - luciano