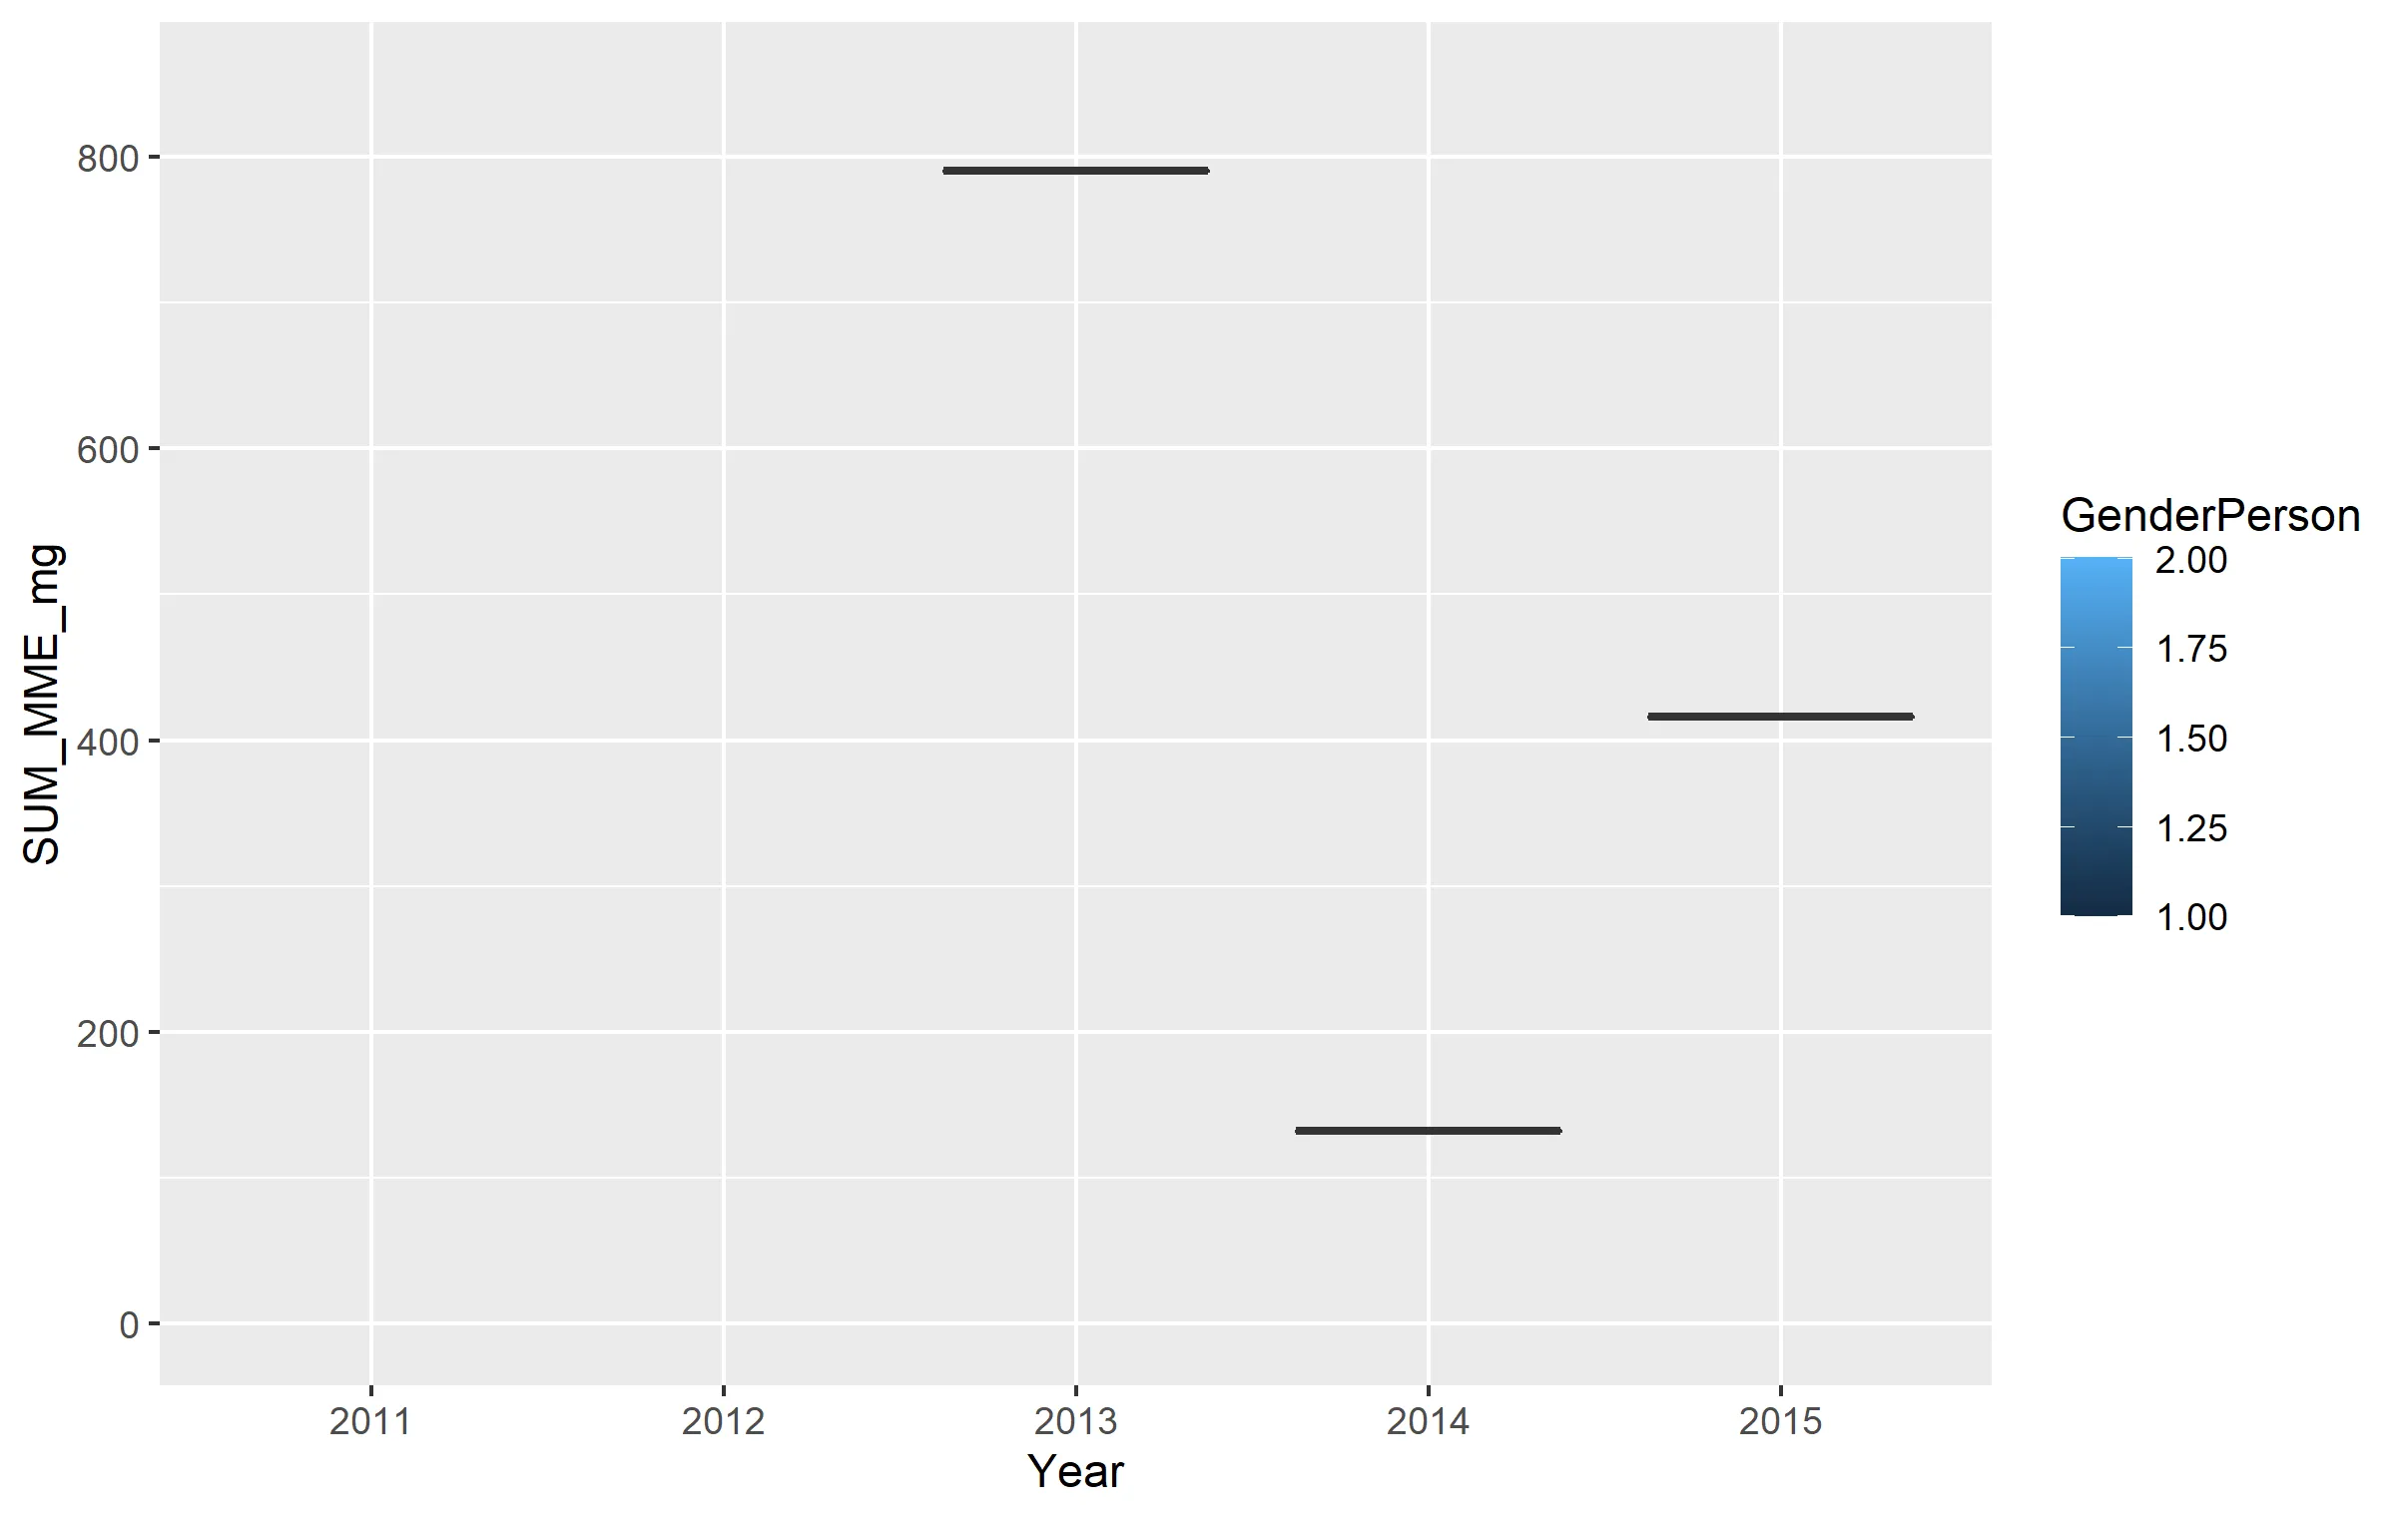
我正在基于大数据(215万个案例)绘制两组体重按年份的简单箱线图。 除了最后一年的最后一组之外,所有组的中位数都相同,但在箱线图上,它被画成与其他所有组相同。
 #boxplot
ggplot(dataset, aes(x=Year, y=SUM_MME_mg, fill=GenderPerson)) +
  geom_boxplot(outlier.shape = NA)+
  ylim(0,850)


#median by group
pivot <- dataset %>%
  select(SUM_MME_mg,GenderPerson,Year )%>%
  group_by(Year, GenderPerson) %>%
  summarise(MedianValues = median(SUM_MME_mg,na.rm=TRUE))
我搞不清楚在盒须图计算或中位数函数中哪些数据更准确,也不知道自己哪里做错了。R 没有报错或警告。
 #my data:
> dput(head(dataset[,c(1,7,10)]))
structure(list(GenderPerson = c(2L, 1L, 2L, 2L, 2L, 2L), Year = c("2015",
"2014", "2013", "2012", "2011", "2015"), SUM_MME_mg = c(416.16,
131.76, 790.56, 878.4, 878.4, 878.4)), row.names = c(NA, 6L), class = "data.frame")