所以我有一个相当大的数据集(Dropbox:csv文件),我正在尝试使用
geom_boxplot进行绘图。以下内容产生了一个看起来合理的图形:require(reshape2)
require(ggplot2)
require(scales)
require(grid)
require(gridExtra)
df <- read.csv("\\Downloads\\boxplot.csv", na.strings = "*")
df$year <- factor(df$year, levels = c(2010,2011,2012,2013,2014), labels = c(2010,2011,2012,2013,2014))
d <- ggplot(data = df, aes(x = year, y = value)) +
geom_boxplot(aes(fill = station)) +
facet_grid(station~.) +
scale_y_continuous(limits = c(0, 15)) +
theme(legend.position = "none"))
d
然而,当你深入挖掘时,问题开始出现并使我感到惊慌。当我标注箱线图中位数的值时,会得到以下图形结果。
df.m <- aggregate(value~year+station, data = df, FUN = function(x) median(x))
d <- d + geom_text(data = df.m, aes(x = year, y = value, label = value))
d
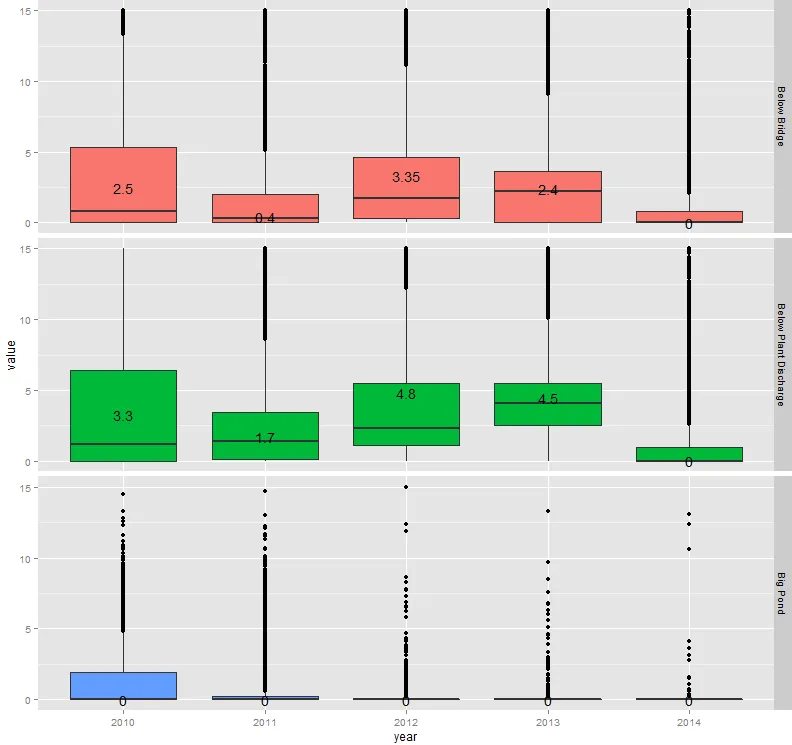
使用geom_boxplot绘制的中位数并不是真正的中位数。标签在正确的y轴值处绘制,但箱线图的中位数明显不在中位数位置上。我已经被这个问题难住了几天。
出现这种情况的原因是什么?如何制作具有正确中位数的此类型显示?如何调试或诊断此图?
temp.m调用geom_text,但中位数是计算在turb.m中的。这可能是问题所在吗? - vpipktyear是什么数据类型? - vpipkt