是的,我知道这个问题一直存在。我也在谷歌群组中找到了哈德利的答案,即ggplot2箱线图目前还没有缺口。所以我的问题有两个:这个情况是否有改变(是否已经有原生实现的缺口),如果没有,是否有什么方法可以解决这个问题。
我的意思是我并不需要缺口外观,通过某些适当放置在箱线图上另一层的阴影区域来表示置信区间,也会看起来很不错。
同时,我添加了一个截图,因为我听说一个图形问题没有图形就不完整。
更新
除了下面详细介绍的选项之外,ggplot2 的 0.9.0 版本还在 geom_boxplot 中包含了此功能。查看 ?geom_boxplot 可以发现有 notch 和 notchwidth 参数:
+ geom_boxplot(notch = TRUE, notchwidth = 0.5)
这里提供的图形不太优美,但是下面是一个示例:
# confidence interval calculated by `boxplot.stats`
f <- function(x) {
ans <- boxplot.stats(x)
data.frame(ymin = ans$conf[1], ymax = ans$conf[2])
}
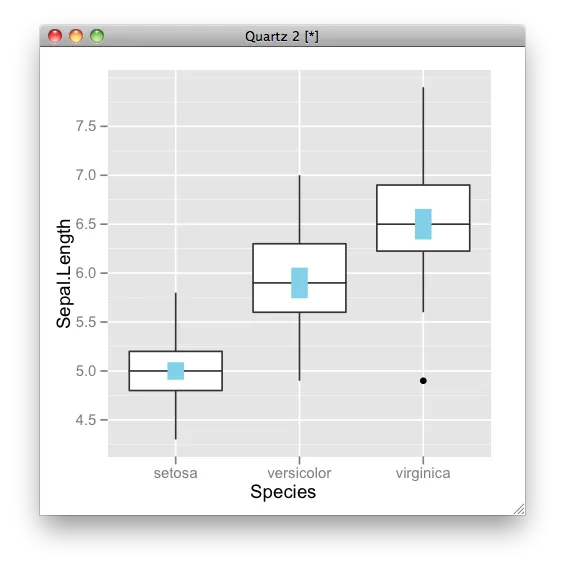
# overlay plot (upper panel below)
p <- ggplot(iris, aes(Species, Sepal.Length)) + geom_boxplot() +
stat_summary(fun.data = f, geom = "linerange", colour = "skyblue", size = 5)
p
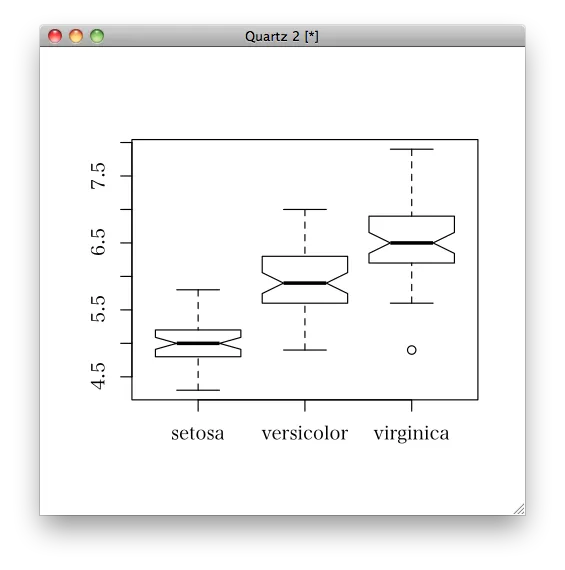
# base graphics (lower panel below)
boxplot(Sepal.Length ~ Species, data = iris, notch = TRUE)
stat_summary的参数来改变 CI 条的外观。
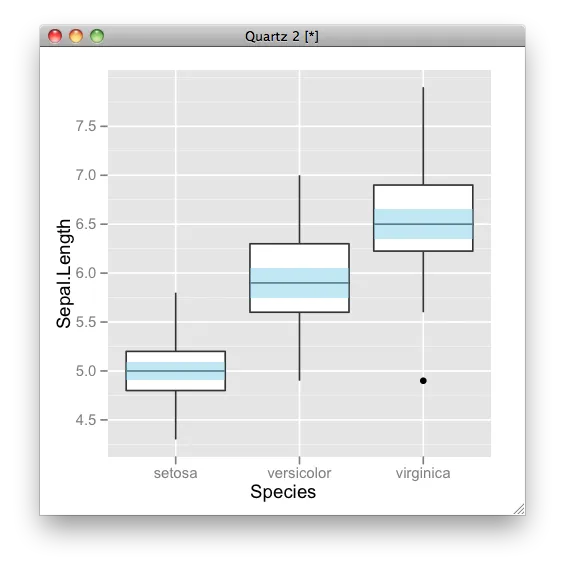
Crossbar版本:
f <- function(x) {
  ans <- boxplot.stats(x)
  data.frame(ymin = ans$conf[1], ymax = ans$conf[2], y = ans$stats[3])
}

p <- ggplot(iris, aes(Species, Sepal.Length)) +
  geom_boxplot(width = 0.8) +
  stat_summary(fun.data = f, geom = "crossbar",
    colour = NA, fill = "skyblue", width = 0.8, alpha = 0.5)
p
有趣的是,在ggplot2-dev邮件列表上发布了一篇关于缺口箱形图的帖子。
您可以在github上找到开发页面。该程序包可通过以下方式安装:
# install.packages("devtools")
library(devtools)
install_github("ggplot2")