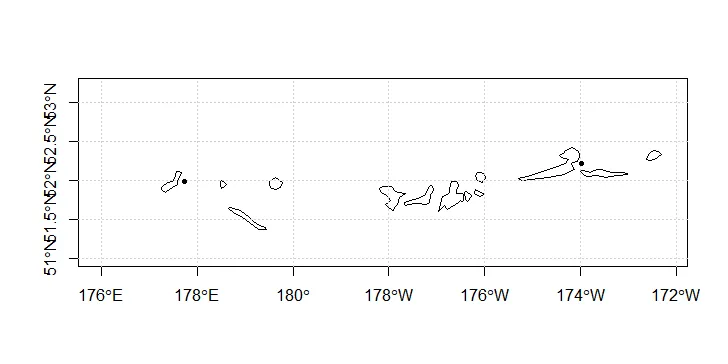
我正在使用sf来绘制一系列的shapefile和点数据,该数据跨越了以经度=-/+180为界的日期线。
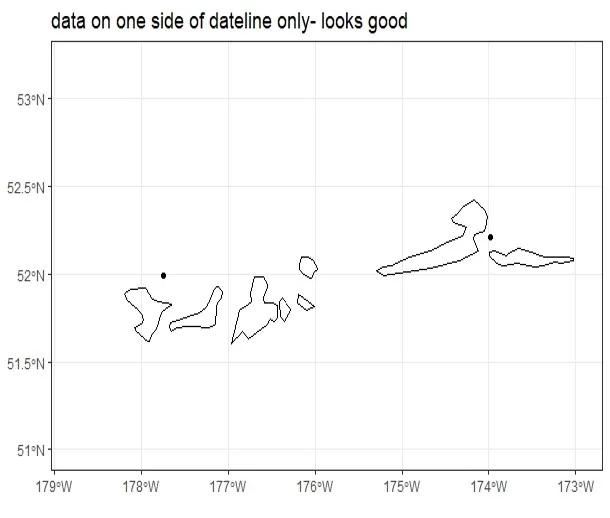
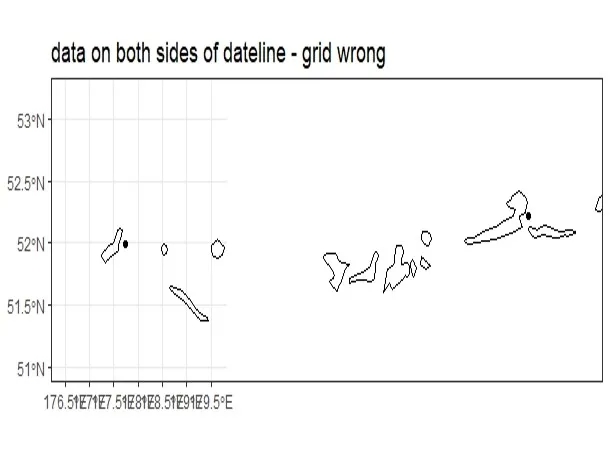
sf::st_shift_longitude()可以处理这种情况,并按预期绘制点。然而,在分配经度刻度时,ggplot的行为很奇怪。下面的代码提供了一个例子,其中有两个点在日期线的一侧 - 请注意ggplot为经度添加了逻辑刻度标记。在第二个例子中,点跨越日期线。
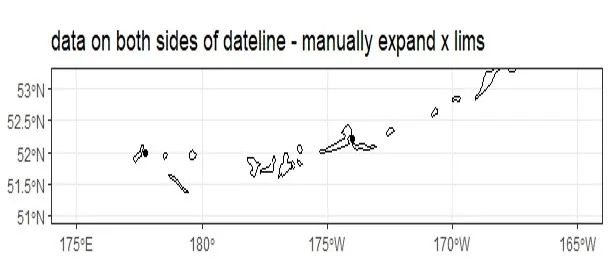
编辑:添加了第三种情况,手动扩展x轴限制。当这些限制足够大时,格网将按预期绘制。但是,我只是通过试验xlim找到了“足够大”的值。
library(sf)
library(rnaturalearth)
library(ggplot2)

#get basic world map
world = ne_coastline(scale = "medium", returnclass = "sf")

#example 1: without dateline
#minimal data- two points on one side of dateline
sites = data.frame(longitude = c(-173.9793, -177.7405), latitude = c(52.21415, 51.98994))

#convert to sf object
sites = st_as_sf(sites, coords = c("longitude", "latitude"), crs = 4326)

#plot with ggplot
ggplot()+
  geom_sf(data = world, fill = 'transparent')+
  geom_sf(data = sites)+
  #set the limits for the plot
  coord_sf(crs = 4326,
           xlim = c(min(st_coordinates(sites)[,1]) -1, max(st_coordinates(sites)[,1])+1),
           ylim = c(min(st_coordinates(sites)[,2]) -1, max(st_coordinates(sites)[,2])+1))+
  labs(title = 'data on one side of dateline only- looks good')+
  theme_bw()


#example 2: with dateline
#deal with dateline using st_shift_longitude
world_2 = st_shift_longitude(world)

#minimal data- a point on each side of dateline
sites_2 = data.frame(longitude = c(-173.9793, 177.7405), latitude = c(52.21415, 51.98994))

#convert to sf object
sites_2 = st_as_sf(sites_2, coords = c("longitude", "latitude"), crs = 4326)
#and deal with dateline using st_shift_longitude
sites_2 = st_shift_longitude(sites_2)

#plot with ggplot
ggplot()+
  geom_sf(data = world_2, fill = 'transparent')+
  geom_sf(data = sites_2)+
  #set the limits for the plot
  coord_sf(crs = 4326,
           xlim = c(min(st_coordinates(sites_2)[,1]) -1, max(st_coordinates(sites_2)[,1])+1),
           ylim = c(min(st_coordinates(sites_2)[,2]) -1, max(st_coordinates(sites_2)[,2])+1))+
  labs(title = 'data on both sides of dateline - grid wrong')+
  theme_bw()

#plot with manually expanded limits- graticule works
ggplot()+
  geom_sf(data = world_2, fill = 'transparent')+
  geom_sf(data = sites_2)+
  #set the limits for the plot
  coord_sf(crs = 4326,
           xlim = c(175, 195),
           ylim = c(min(st_coordinates(sites_2)[,2]) -1, max(st_coordinates(sites_2)[,2])+1))+
  labs(title = 'data on both sides of dateline - manually expand x lims')+
  theme_bw()
当使用ggplot绘图时,你有没有任何解决国际日期变更线问题的想法?
谢谢!