使用 ggplot2 绘制“序列标志”图形?
39
- Tal Galili
10
31我个人认为这是一个糟糕的情节,希望 ggplot2 没有实现它的方式! - hadley
2似乎很容易通过简单地堆叠条形图来生成一个更美观的图表,以表示相同的信息。您可能需要花费更多的精力来正确设置x轴上的注释。 - Ben Bolker
2Tal,你能提供一些样本数据吗?你可能只需要使用geom_text()就可以完成。 - Brandon Bertelsen
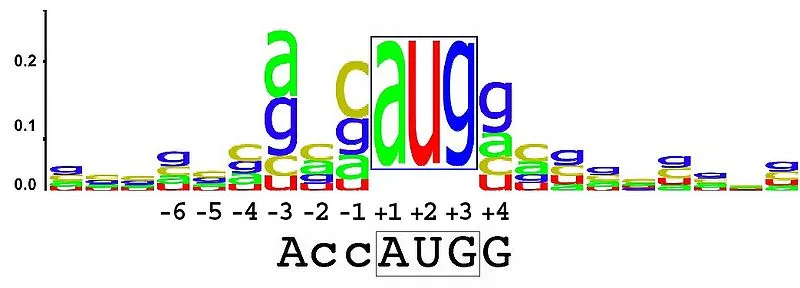
10这些序列图是生物学中代表序列基序的常用方法。我理解在DNA只有4种字母的情况下,堆叠条形图可能是合理的选择;然而,在氨基酸序列中,字母表有22个字母。 - GWW
4我认为这是生物信息学中重要且常用的绘图类型,因此我希望ggplot2有一种方法可以实现它! - Curt F.
显示剩余5条评论
6个回答
13
ggseqlogo应该是您在寻找的内容。我希望这可以解决您在使用R绘制序列标志时遇到的一些挫折。
- Omar Wagih
1
嗨,Omar,ggseqlogo能在数据框上工作吗?我有氨基酸及其计数和百分比数据,想要绘制它们。 - Marwah Al-kaabi
11
我提交了一个
ggplot2的尝试,与Leipzig/Berry解决方案有些相似。这种格式更接近于标准的形态图。但是我的解决方案,以及我认为所有的ggplot2解决方案,仍然存在缺陷,因为ggplot2无法控制绘图符号的纵横比。这是生成序列标志所需的核心功能(我认为),而ggplot2缺少这个功能。另外请注意:我使用了Jeremy Leipzig的答案中的数据,但我没有对小样本量或不同于50%的GC值进行任何校正。require(ggplot2)
require(reshape2)
freqs<-matrix(data=c(0.25,0.65,0.87,0.92,0.16,0.16,0.04,0.98,0.98,1.00,0.02,0.10,0.10,0.80,0.98,0.91,0.07,0.07,0.11,0.05,0.04,0.00,0.26,0.17,0.00,0.01,0.00,0.00,0.29,0.17,0.01,0.03,0.00,0.00,0.32,0.32,0.53,0.26,0.07,0.02,0.53,0.18,0.96,0.01,0.00,0.00,0.65,0.01,0.89,0.17,0.01,0.09,0.59,0.12,0.11,0.04,0.02,0.06,0.05,0.49,0.00,0.00,0.02,0.00,0.04,0.72,0.00,0.00,0.01,0.00,0.02,0.49),byrow=TRUE,nrow=4,dimnames=list(c('A','C','G','T')))
freqdf <- as.data.frame(t(freqs))
freqdf$pos = as.numeric(as.character(rownames(freqdf)))
freqdf$height <- apply(freqdf[,c('A', 'C','G','T')], MARGIN=1,
FUN=function(x){2-sum(log(x^x,base=2))})
logodf <- data.frame(A=freqdf$A*freqdf$height, C=freqdf$C*freqdf$height,
G=freqdf$G*freqdf$height, T=freqdf$T*freqdf$height,
pos=freqdf$pos)
lmf <- melt(logodf, id.var='pos')
quartz(height=3, width=8)
ggplot(data=lmf, aes(x=as.numeric(as.character(pos)), y=value)) +
geom_bar(aes(fill=variable,order=value), position='stack',
stat='identity', alpha=0.5) +
geom_text(aes(label=variable, size=value, order=value, vjust=value),
position='stack') +
theme_bw()
quartz.save('StackOverflow_5438474.png', type='png')
这将生成以下图表:
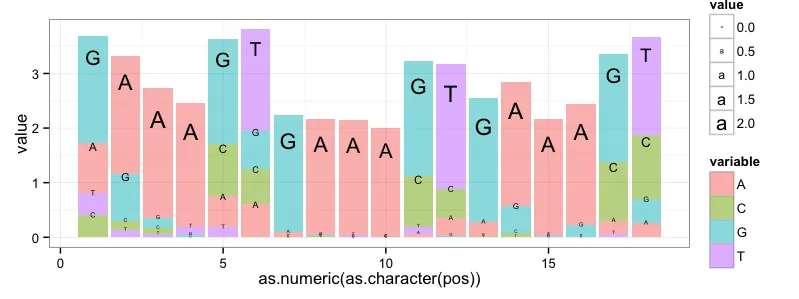
- Curt F.
10
我已经实现了 Charles Berry 设计的一种替代方案,它解决了在下面评论区中反复讨论的 seqLogos 的一些弱点。它使用 ggplot2:
library("devtools")
install_github("leipzig/berrylogo")
library("berrylogo")
freqs<-matrix(data=c(0.25,0.65,0.87,0.92,0.16,0.16,0.04,0.98,0.98,1.00,0.02,0.10,0.10,0.80,0.98,0.91,0.07,0.07,0.11,0.05,0.04,0.00,0.26,0.17,0.00,0.01,0.00,0.00,0.29,0.17,0.01,0.03,0.00,0.00,0.32,0.32,0.53,0.26,0.07,0.02,0.53,0.18,0.96,0.01,0.00,0.00,0.65,0.01,0.89,0.17,0.01,0.09,0.59,0.12,0.11,0.04,0.02,0.06,0.05,0.49,0.00,0.00,0.02,0.00,0.04,0.72,0.00,0.00,0.01,0.00,0.02,0.49),byrow=TRUE,nrow=4,dimnames=list(c('A','C','G','T')))
p<-berrylogo(freqs,gc_content=.41)
print(p)
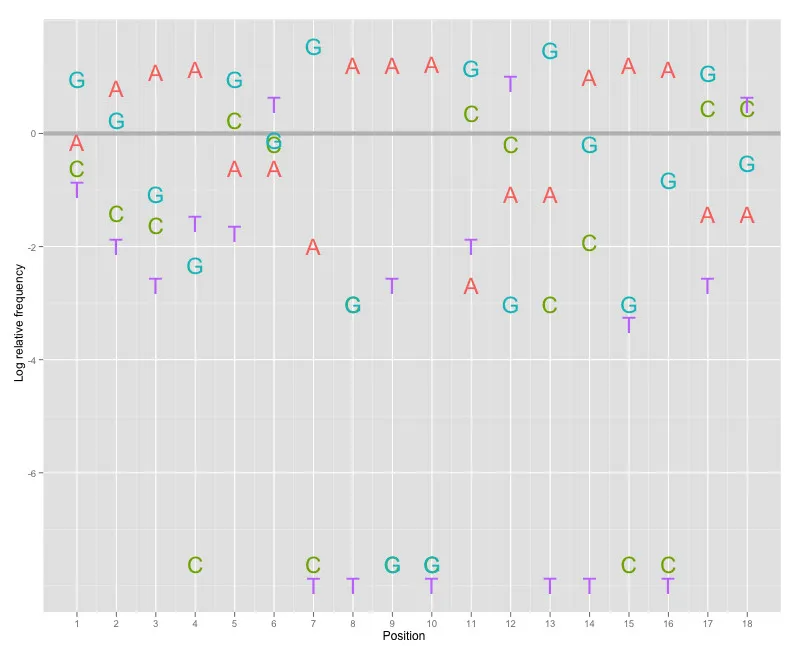
- Jeremy Leipzig
9
1不错。它能自然地推广到氨基酸序列吗?您能获取X轴注释(共识或最可能的序列——我不知道上面示例中的大写字母表示什么),可能通过添加一个固定Y值的小型绘图来实现吗? - Ben Bolker
您介意详细说明一下您提到的“问题”以及您建议如何解决它们吗?我发现由于大约80%的情节没有/重复数据,所以很难获取主要信息,但这可能只是因为我不习惯这种表达方式。此外,我不明白您的链接应该如何帮助,因为链接的网站也没有包含该信息。到目前为止,我只看到了您的软件包广告(可能很棒),指向您的出版物的链接和一个未经解释的情节,仅仅是比OP要求的更好,而没有任何代码来说明如何获得它。 - mschilli
你的图表如何改进它?仍然A会高于G。而且从OP的示例图表中可以看出它很接近。我同意在这种情况下“共识”序列是有问题的,所以让我们不考虑它。此外,我仍然没有看到从易于解释的单位“比特”转换为“对数相对频率”的理由。另外,我认为一个好的SE答案应该包含如何获得结果的代码(请参考by0的答案)。 - mschilli
一个berryLogo不会隐藏高度不受欢迎的核苷酸 - 它会突出它们。如果两个核苷酸的频率非常接近,那么它们将重叠而不是放在一个踏板上。老实说,我怀疑大多数生物学家都不了解足够的信息理论知识,以知道“比特”意味着什么,但至少通过berryLogo,您可以知道哪些核苷酸经常发生。我会发布代码。感谢您的关注。 - Jeremy Leipzig
感谢更新代码。你关于不受欢迎的核苷酸的观点是有道理的。我仍然更喜欢使用位 + 我怀疑了解对数相对频率的人会无法理解基本的信息理论。 ;) 对于一个好的替代方案和良好的讨论,加1个赞。 :) - mschilli
显示剩余4条评论
4
据我所知,在ggplot2中没有直接的方法来实现这一点。
但是,可以查看RWebLogo。它是我为WebLogo python库编写的R包装器。您可以从CRAN下载它,并且它托管在github上。
简单示例:
但是,可以查看RWebLogo。它是我为WebLogo python库编写的R包装器。您可以从CRAN下载它,并且它托管在github上。
简单示例:
# Load package
library('RWebLogo')

# Sample alignment
aln <- c('CCAACCCAA', 'CCAACCCTA', 'AAAGCCTGA', 'TGAACCGGA')
# Plot logo to file
weblogo(seqs=aln, file.out='logo.pdf')

# Plot logo to R graphics device (uses generated jpeg logo and raster package)
weblogo(seqs=aln, plot=TRUE, open=FALSE, format='jpeg', resolution=600)
更多选项请参见?weblogo或?plotlogo
- Omar Wagih
3
现在有一个名为
该包可生成以下类型的图表:
这个例子来自https://github.com/heike/gglogo/blob/master/visual_test/logos.R,这里还有关于该软件包的手稿:https://github.com/heike/logopaper/blob/master/logos.Rmd。请查看以下内容:
gglogo的包(也在CRAN上,是Heike Hofmann开发的另一个令人惊叹的ggplot2扩展)。该包可生成以下类型的图表:
library(ggplot2)
library(gglogo)
ggplot(data = ggfortify(sequences, "peptide")) +
  geom_logo(aes(x=position, y=bits, group=element,
     label=element, fill=interaction(Polarity, Water)),
     alpha = 0.6)  +
  scale_fill_brewer(palette="Paired") +
  theme(legend.position = "bottom")
这个例子来自https://github.com/heike/gglogo/blob/master/visual_test/logos.R,这里还有关于该软件包的手稿:https://github.com/heike/logopaper/blob/master/logos.Rmd。请查看以下内容:
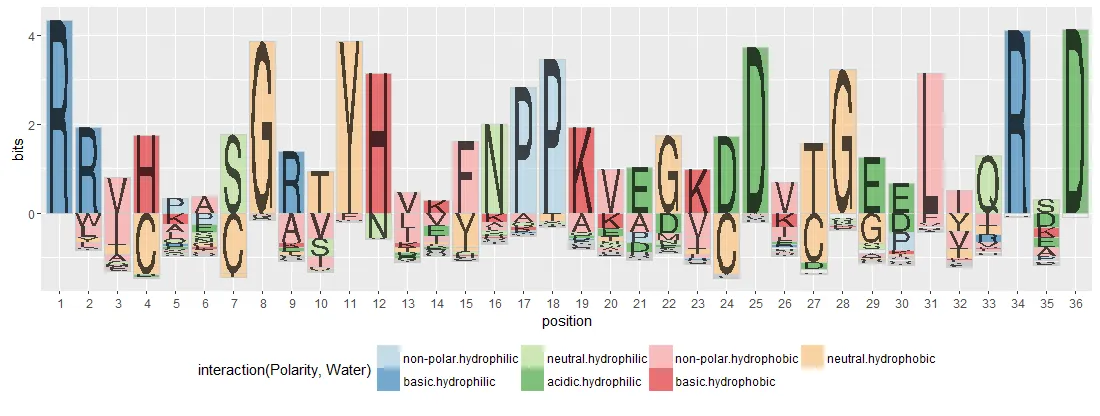
- Ben
3
这里有一个替代方案。motiflogo 是由ggplot2实现的序列模体(motif)标志的新表现形式。可以考虑两个方面:
- 作为典型的模体标志表现
- 作为特异性单核苷酸多态性(SNP-specific motif)标志表现
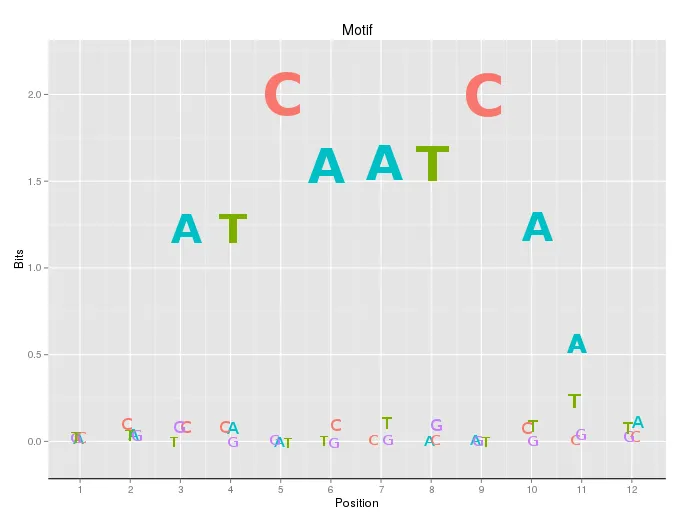
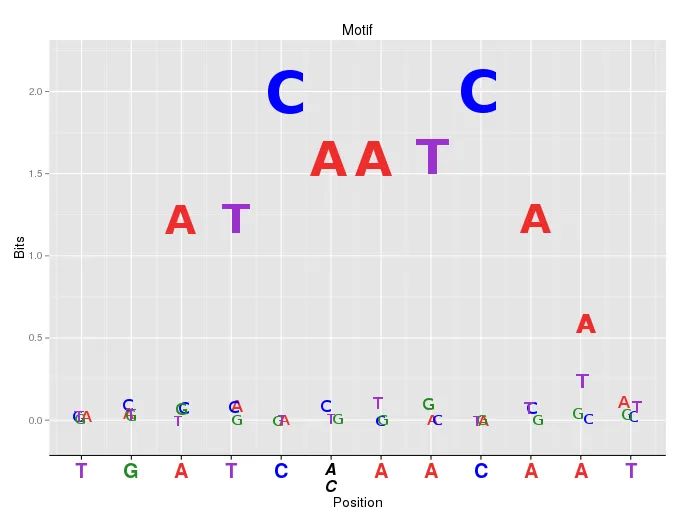
- Zhilong Jia
2
“序列标志”部分似乎与沿x轴的“共识序列”无关。您能简要解释一下第6和第8个位置上的x轴标签与沿y刻度显示的高熵碱基有什么关系吗? - Alex Reynolds
@AlexReynolds,X轴上的字母是SNP,在图2中显示的字母是motif。当然,SNP和motif高度匹配,但并非完全匹配。 - Zhilong Jia
网页内容由stack overflow 提供, 点击上面的可以查看英文原文,
原文链接
原文链接