如果内容不够清晰,请多包涵,并随时提问……
我正在尝试根据以下链接进行50年极端风计算。
http://www.wasp.dk/Products/weng/ExtremeWinds.htm
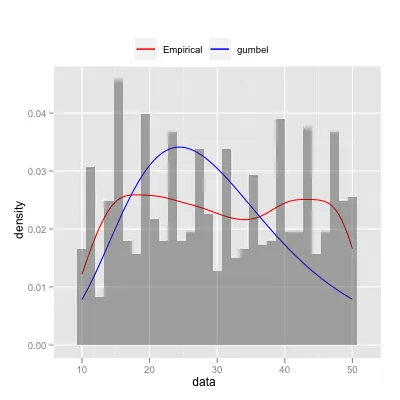
他们似乎使用了Gumbel分布,因此我使用“evir”包中的gumbel函数将分布拟合到数据上,并使用“evd”包中的dgumbel函数作为绘图函数。package("evd")
package("evir")
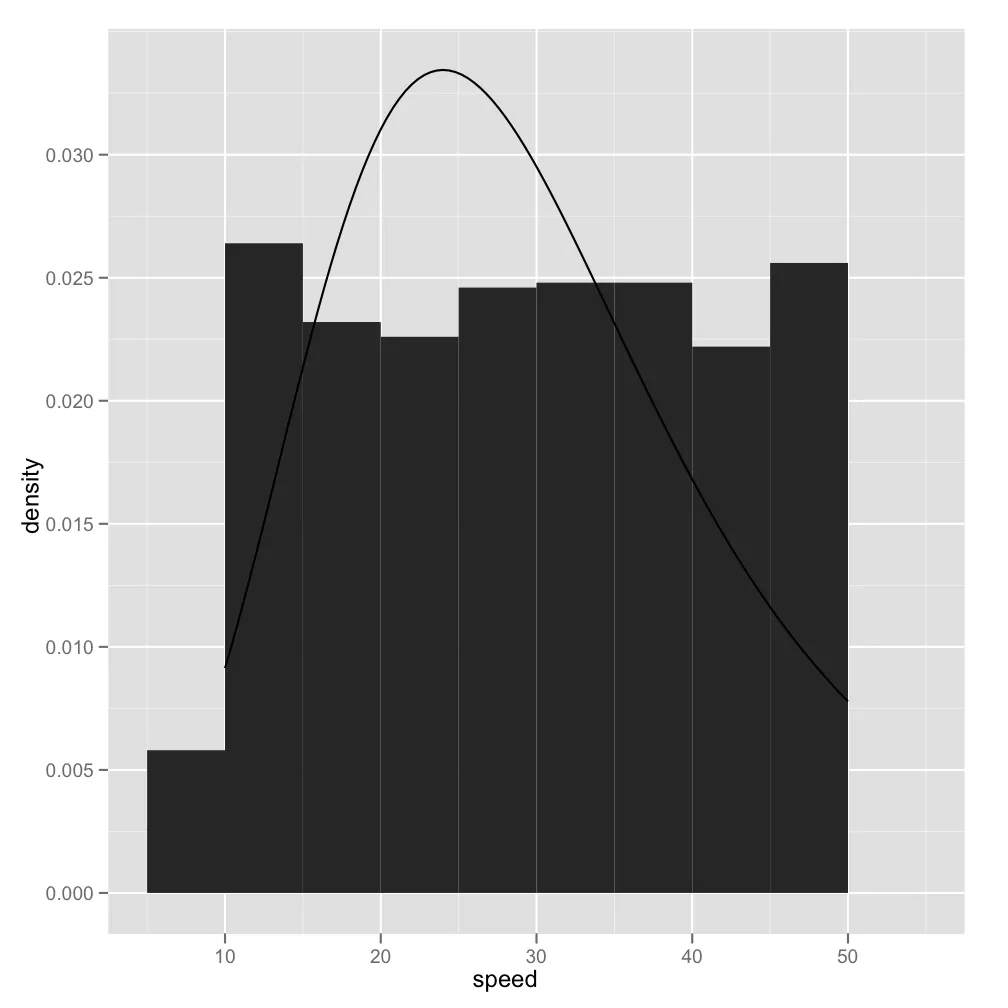
speeds2 <- data.frame(speed=sample(10:50,1000,rep=TRUE))
gumbel(speeds2$speed)
我随后尝试使用ggplot2的stat_function绘制它,就像这样(除了现在我已经放入loc和scale的虚拟值。
library(ggplot2)
ggplot(data=speeds2, aes(x=speed)) +
  stat_function(fun=dgumbel, args=list(loc=1, scale=0.5))
我得到以下错误:
Error in dgev(x, loc = loc, scale = scale, shape = 0, log = log) :
  unused argument(s) (loc = loc, scale = scale, shape = 0, log = log)
我不确定我是否以正确的方式进行操作。任何指导都将不胜感激。
dgumbel?它不是 r-base 的分发版。即使已经加载了 VGAM,gumbel() 调用仍然会抛出一个错误。 - IRTFMevd中获取dgumbel(参见:http://tiny.cc/8izrk)。是否有基本函数? - Chrisevir函数覆盖evd函数无关,那么这可能是正确的。尝试进行干净的会话。不要加载evir(它没有命名空间,因此您无法使用:::运算符),然后运行您的绘图。另外,您应该编辑您的问题以指示需要哪些库或require调用。 - IRTFMevd没有命名空间。 - IRTFM