我已经用ggplot2创建了两个多面板图。我想在图形区域外添加一个箭头。有多个问题试图解决这个问题:
如何在ggplot2中绘制图形区域外的线条?
在ggplot2生成的图形下方显示文本
但是我无法让我的示例工作。而且,我希望有一种更简单的方法来完成这个任务?
我尝试增加
plot.margins并使用coord_cartesian(),但都没有帮助。
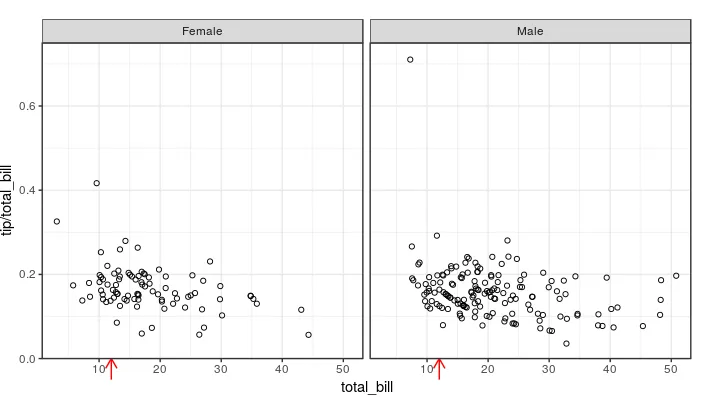
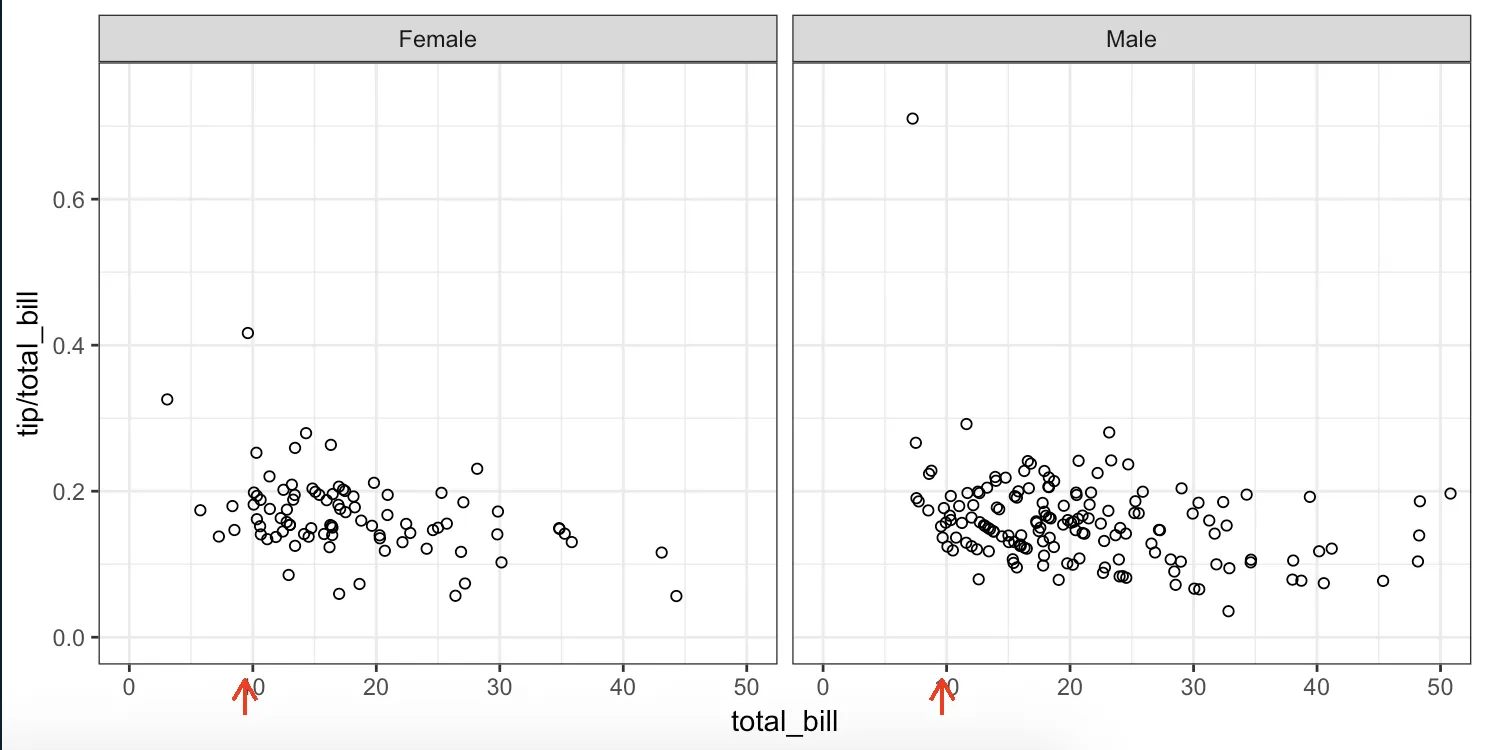
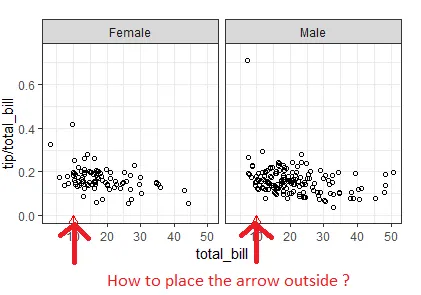
相反,我想要:
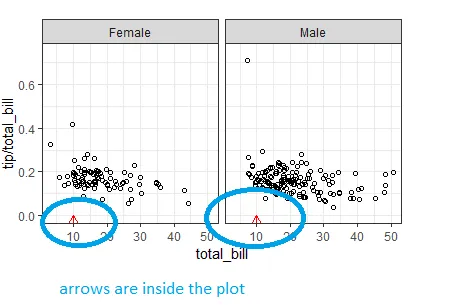
我的示例:
# read library to assess free data
library(reshape2)
library(ggplot2)


ggplot(tips,
       aes(x=total_bill,
           y=tip/total_bill)) +
  geom_point(shape=1) +
  facet_grid(. ~ sex) +
  # define the segment outside the plot
  geom_segment(aes(x = 10,
                   y = -0.25,
                   xend = 10,
                   yend = 0),
               col = "red",
               arrow = arrow(length = unit(0.3, "cm"))) +
  theme_bw() +
  # limit the displayed plot extent
  coord_cartesian(ylim = c(0, 0.75)) +
  # increase plot margins - does not help
  theme(plot.margin = unit(c(1,1,1,0), "lines"))