我正在尝试在 ggplot2 中的柱状图底部绘制一些线段,并叠加一些线段来指示分布的相关部分。我希望绿色线段的厚度是灰色线段的两倍,但是绿色线段似乎总是比灰色线段厚五倍。这里是一些玩具数据和我的 ggplot2 代码:
我的结果是: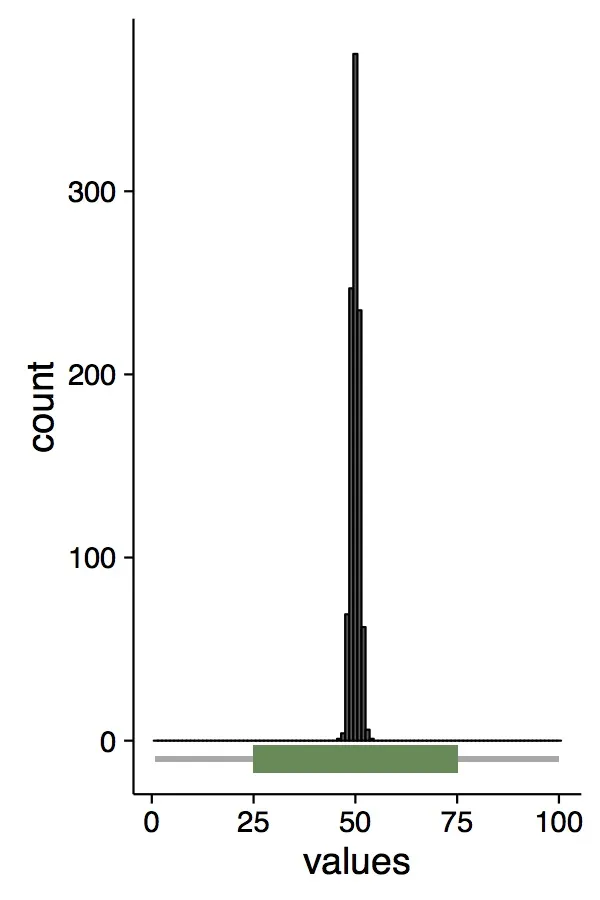
library(ggplot2)
x<- as.data.frame(rnorm(1000, mean=50))
colnames(x) <- c("values")

ggplot(x, aes(x=values)) +
geom_histogram (binwidth=1,position="identity", col="black")+
 theme_classic(base_size=18)+
theme(axis.line.x = element_line(colour = "black"),
axis.line.y = element_line(colour = "black"))+
geom_segment(aes(y=-10, yend=-10, col=I("darkgray"), size=.1,x=1, xend=100),show.legend=F)+
geom_segment(aes(y=-10, yend=-10, col=I("palegreen4"), size=.2,x=25,xend=75), show.legend=F)
我的结果是: