为面板图中的单个面板添加几何图层

18

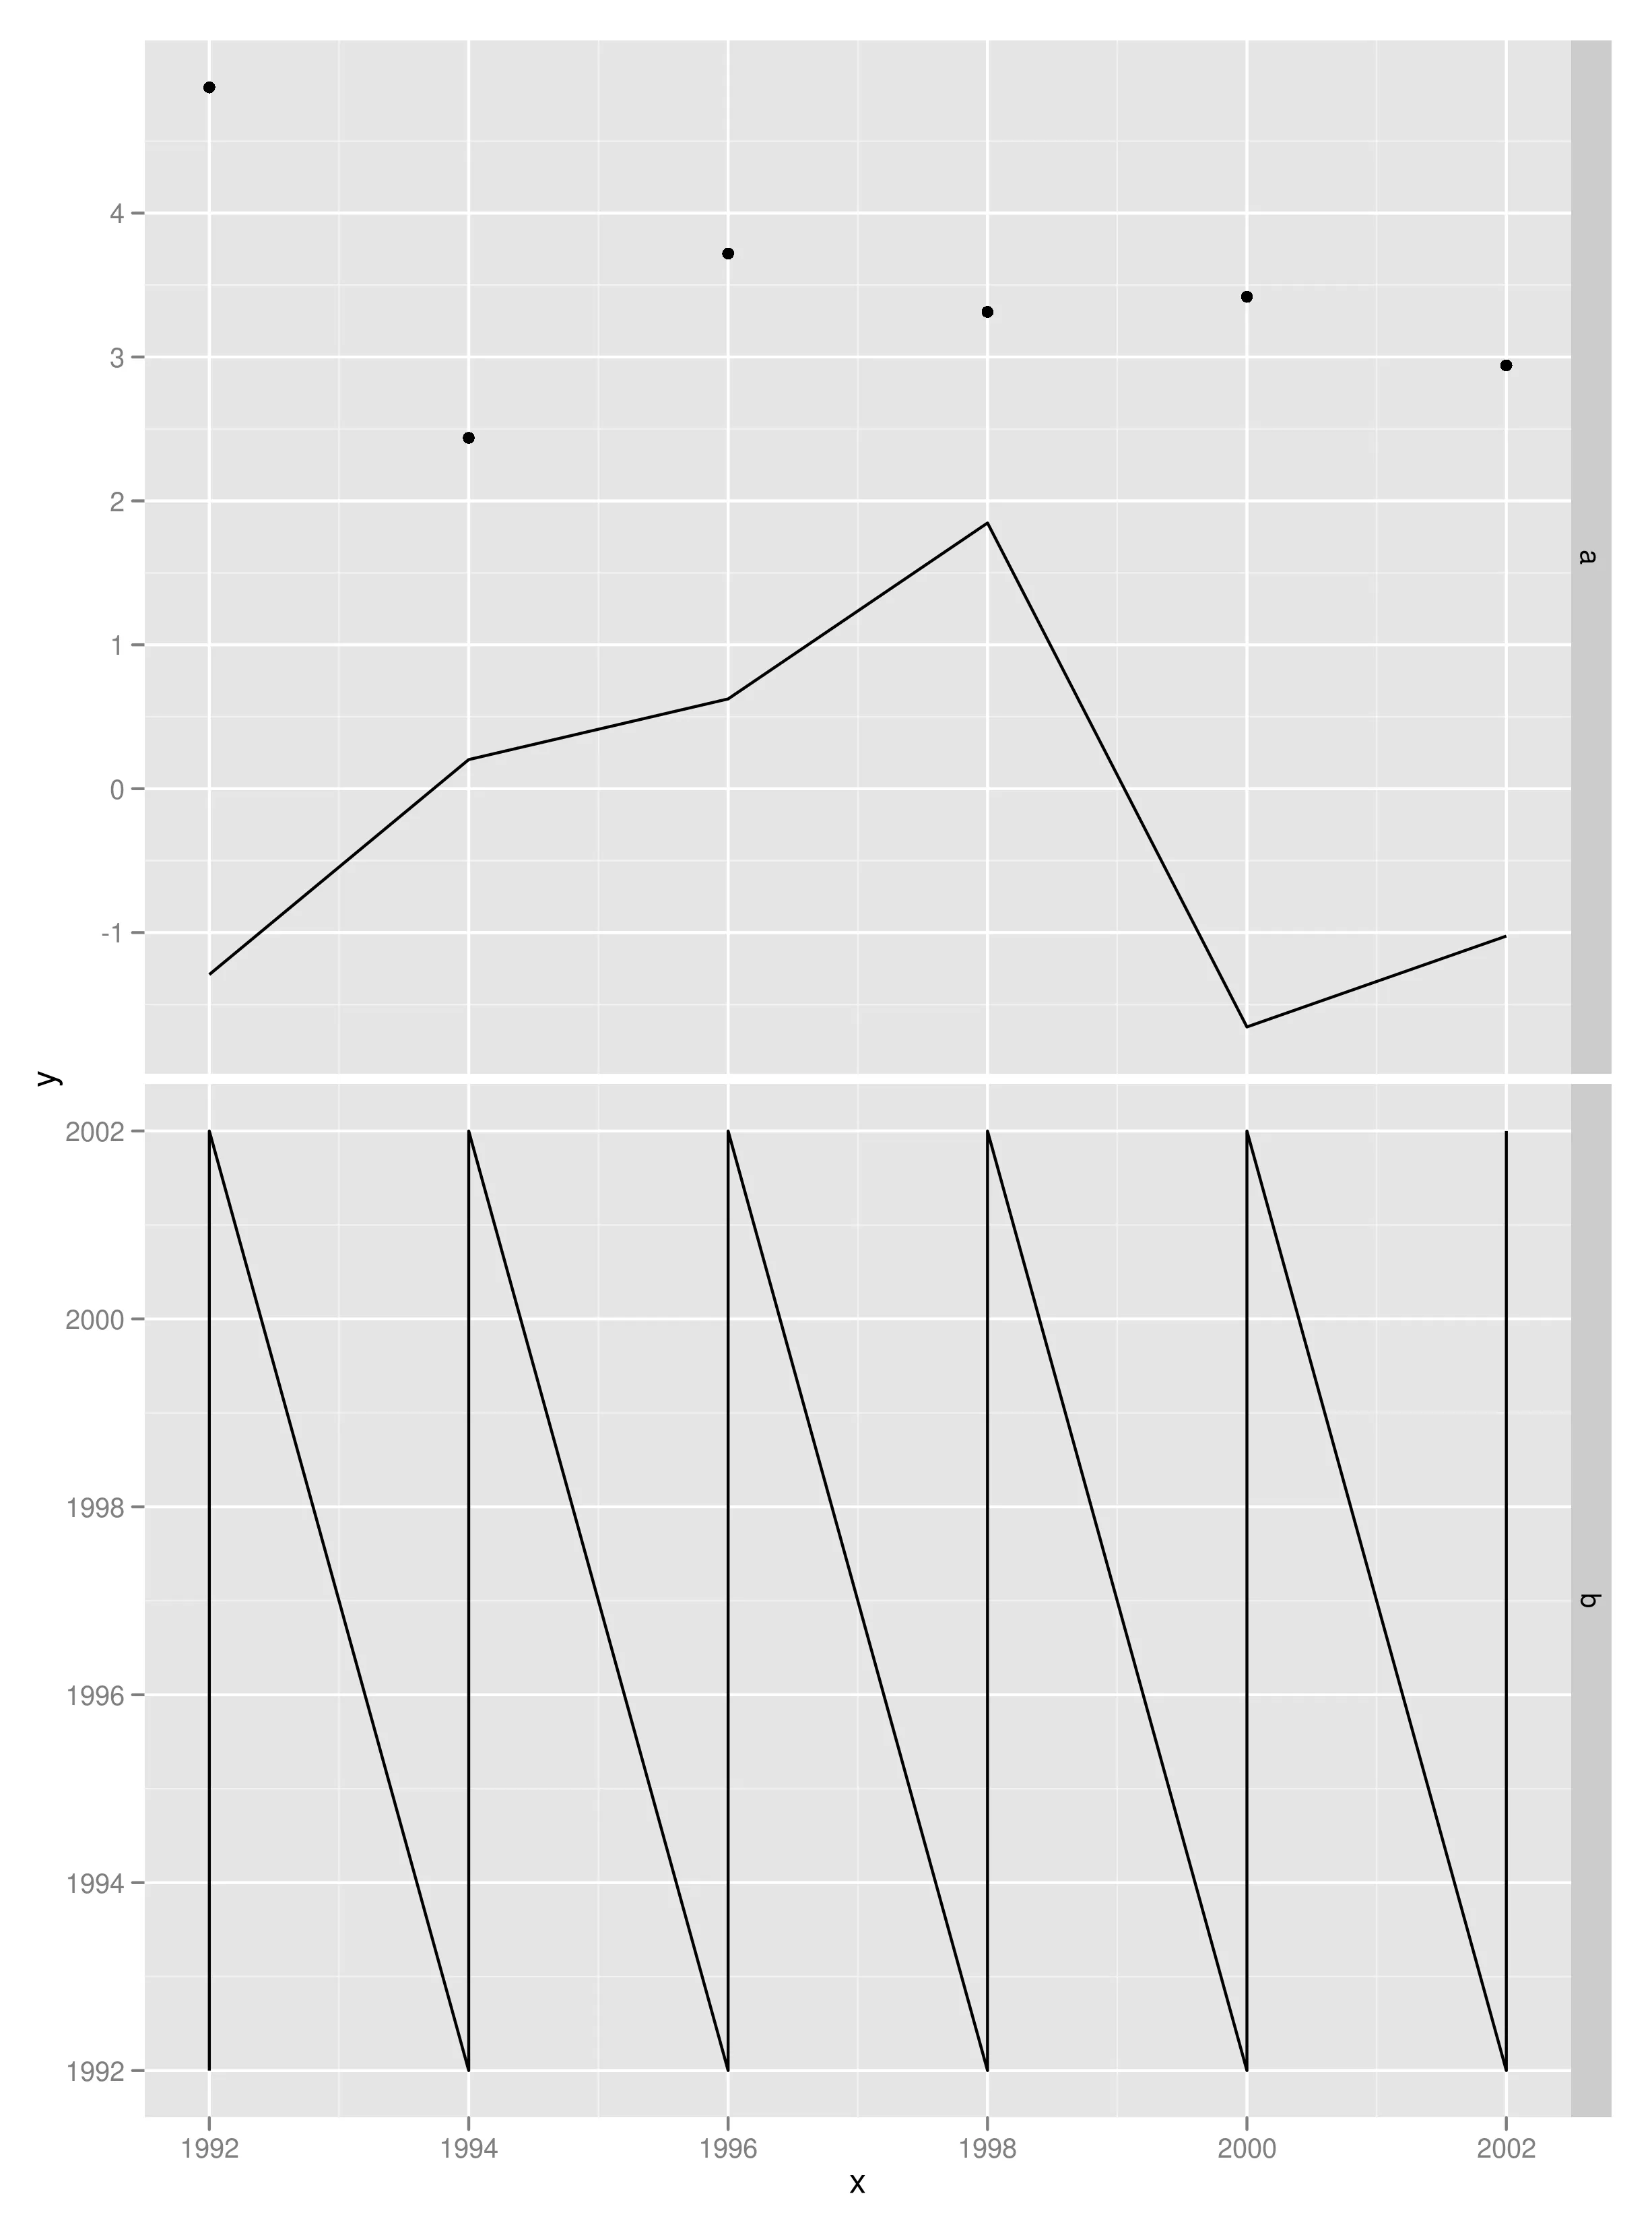
参考以下链接(使用ggplot2对齐两个图表),我能够在一个共同的x轴下绘制两个“y”变量。现在我想做的是只能向其中一个facet添加一个geom_point层。这个层使用不同的数据集(d3),但结构与d1相同。当我添加这个层时,它会被用于两个facets。是否可能只将点层叠放在上面的facet中。

library(ggplot2)

x <- seq(1992, 2002, by = 2)
d1 <- data.frame(x = x, y = rnorm(length(x)))
xy <- expand.grid(x = x, y = x)
d2 <- data.frame(x = xy$x, y = xy$y, z = jitter(xy$x + xy$y))
d3 <- data.frame(x = x, y = 3+rnorm(length(x)))

d1$panel <- "a"
d2$panel <- "b"
d1$z <- d1$x

d <- rbind(d1, d2)

p <- ggplot(data = d, mapping = aes(x = x, y = y))
p <- p + facet_grid(panel ~ ., scale = "free")
p <- p + layer(data = d1,  geom = c( "line"), stat = "identity")
###*p <- p + layer(data = d3,  geom = c( "point"))* - This is the layer I intend to add only to the top panel

p <- p + layer(data = d2,  geom = "line", stat = "identity")
p

2
+1,问题表述得很好,并且提供了可重现的示例。 - Paul Hiemstra
1个回答

12

只需在d3中添加panel列,并将要添加点集的面板添加到其中。在您的情况下:

d3$panel = "a"

p <- ggplot(data = d, mapping = aes(x = x, y = y))
p <- p + facet_grid(panel ~ ., scale = "free")
p <- p + layer(data = d1,  geom = c( "line"), stat = "identity")
p <- p + layer(data = d3,  geom = c( "point"))
p <- p + layer(data = d2,  geom = "line", stat = "identity")
p

使用以下代码可以得到正确的输出结果:

enter image description here

如果在调用facet_grid函数时未提及的列不存在,ggplot2会默认将其打印在所有分面上。当指定 panel参数后,ggplot2就会考虑它。


+1 谢谢,保罗。那很容易!在一个相关的问题中,比如在格子图中,是否有一种方法可以获取面板编号的索引,以便能够自定义各个面板(类似于来自格子图的panel.subscripts())? - Vijay Ivaturi
我不太确定你的意思。我建议你创建一个新问题,在那里提供更多细节和一些示例代码。 - Paul Hiemstra
1
ggplot2没有面板编号,因为这与其哲学相违背;相反,您可以通过对应的分面变量来引用给定的面板。 - baptiste

网页内容由stack overflow 提供, 点击上面的
可以查看英文原文,
原文链接