如何在R中的多面板图中为每个面板指定不同的颜色

3

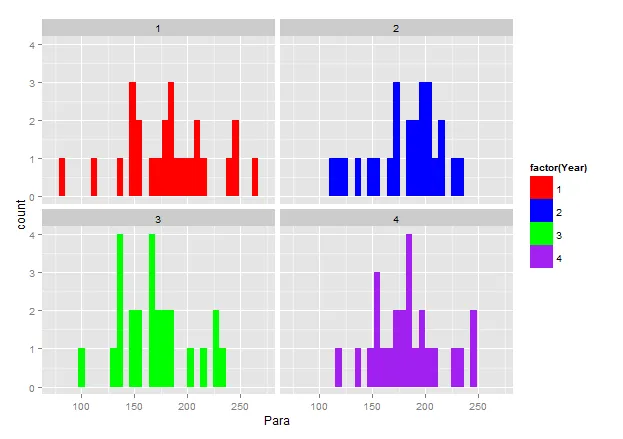
我使用R中的lattice包创建了一个多面板图。该图有四个面板,每个面板都包含一个直方图。我希望每个面板中的条形图颜色是不同的,但我无法实现这一点。

Para = as.vector(rnorm(100, mean=180, sd=35))
Year = as.vector(c(rep(1,25),rep(2,25),rep(3,25), rep(4,25)))
df = as.data.frame(cbind(Para, Year))

library(lattice)
print(histogram(~ Para | Year, data = df, scales = list(cex = c(1.0, 1.0)), 
                layout = c(4, 1), type = "count",
                xlab = list("Parameter", fontsize = 16), 
                ylab = list("Frequency", fontsize = 16), 
                strip = function(bg = 'white',...) strip.default(bg = 'white', ...),
                        breaks = seq(0, 300, by = 50), ylim = seq(0, 35, by = 10),
                        as.table = TRUE, groups = year, col = c("red", "blue", "green", "purple")))

我尝试添加as.table=TRUE, groups=year, col=c("red", "blue", "green", "purple")到代码中,正如在这里找到的相关问题所建议的那样R: specifying color for different facets / panels in lattice,但这只是交替每个面板内条形图的颜色而不是在面板之间。
有什么建议可以解决这个问题将不胜感激!
如果可能的话,我还想知道如何在每个平面上方的条带上实现类似的效果(即是否可以单独设置每个平面条带的背景,而不仅仅是整个图中所有平面的背景?)
非常感谢!
2个回答

4
这是 lattice 版本。基本上,你需要定义一个颜色向量,我是在 histogram() 函数外部定义的。在 histogram() 函数中,你需要使用 panel.function,它可以让每个面板看起来不同。你调用 panel.histogram 并告诉它根据 packet.number() 选择一种颜色。该函数只返回一个整数,表示正在绘制的面板,第一个面板为红色,第二个为蓝色等。
Para = as.vector(rnorm(100, mean=180, sd=35))
Year = as.vector(c(rep(1,25),rep(2,25),rep(3,25), rep(4,25)))
df = as.data.frame(cbind(Para,Year))

colors<-c("red","blue","green","purple")  #Define colors for the histograms

print(histogram(~Para | Year, data = df,  scales=list(cex=c(1.0,1.0)), 
    layout=c(4,1), type="count", xlab=list("Parameter", fontsize=16), 
    ylab=list("Frequency", fontsize=16), 
    strip=function(bg='white',...) strip.default(bg='white',...), 
    breaks=seq(0,300, by=50), ylim=seq(0,35,by=10),
    as.table=TRUE, groups=Year,col=colors, #passing your colors to col

    panel=function(x, col=col,...){
    panel.histogram(x,col=col[packet.number()],...) #gets color for each panel
    }
))

@ John:非常感谢。这太棒了!正是我在寻找的东西。谢谢! - Emily

3
您可以尝试使用一个ggplot的替代品:
library(ggplot2)
ggplot(data = df, aes(x = Para, fill = factor(Year))) +
  geom_histogram() +
  facet_wrap(~ Year) +
  scale_fill_manual(values = c("red", "blue", "green", "purple"))

enter image description here

要按年份为条纹背景上色,您可以查看这里以获取一些想法。


@ Henrik:非常感谢您的回答!但是,如果有办法,我真的很想使用lattice包来实现这一点? - Emily
@Emily,我相信你可以用lattice制作所需的图表。然而,我对lattice不够熟悉,无法帮助你,抱歉... - Henrik

网页内容由stack overflow 提供, 点击上面的
可以查看英文原文,
原文链接