我正在使用VennDiagram软件包制作维恩图。它们看起来还可以:
library(VennDiagram)
library(cowplot)
png("p.png")
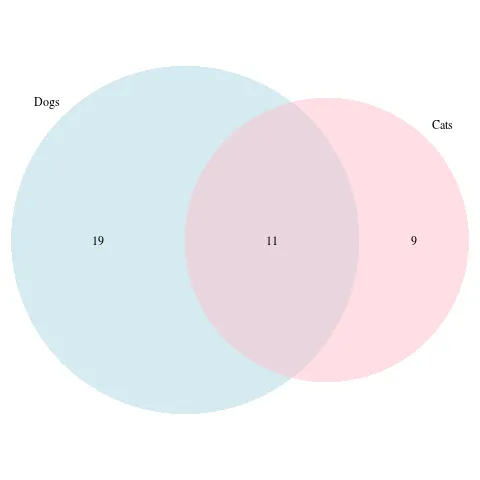
p = draw.pairwise.venn(30,20,11, category = c("Dogs", "Cats"), lty = rep("blank", 2), fill = c("light blue", "pink"), alpha = rep(0.5, 2), cat.pos = c(-45, 45), cat.dist = rep(0.025, 2))
dev.off()
png("q.png")
draw.pairwise.venn(15, 20, 10, category = c("Rats", "Mice"), lty = rep("blank", 2), fill = c("light blue", "pink"), alpha = rep(0.5, 2), cat.pos = c(-45, 45), cat.dist = rep(0.025, 2))
dev.off()

但是如果使用cowplot的plot_grid()函数并排绘制,会出现问题:
p = draw.pairwise.venn(30,20,11, category = c("Dogs", "Cats"), lty = rep("blank", 2), fill = c("light blue", "pink"), alpha = rep(0.5, 2), cat.pos = c(-45, 45), cat.dist = rep(0.025, 2))

q = draw.pairwise.venn(15, 20, 10, category = c("Rats", "Mice"), lty = rep("blank", 2), fill = c("light blue", "pink"), alpha = rep(0.5, 2), cat.pos = c(-45, 45), cat.dist = rep(0.025, 2))

png('pq.png')
plot_grid(p, q, labels = "AUTO")
dev.off()

Error: Argument needs to be of class "ggplot", "gtable", "grob", "recordedplot", or a function that plots to an R graphicsdevice when called, but is a gList
Calls: plot_grid -> align_plots -> lapply -> FUN -> plot_to_gtable
Execution halted
draw.pairwise.venn() 无法与 plot_grid() 兼容。
class(p)
[1] "gList"
所以我想我需要将 gList 转换成 ggplot 对象或其他兼容对象,即使 gList 被列为合适的类型。但我一直没有找到任何内容。我想使用 cowplot,因为它可以很好地标注子图以供出版。
