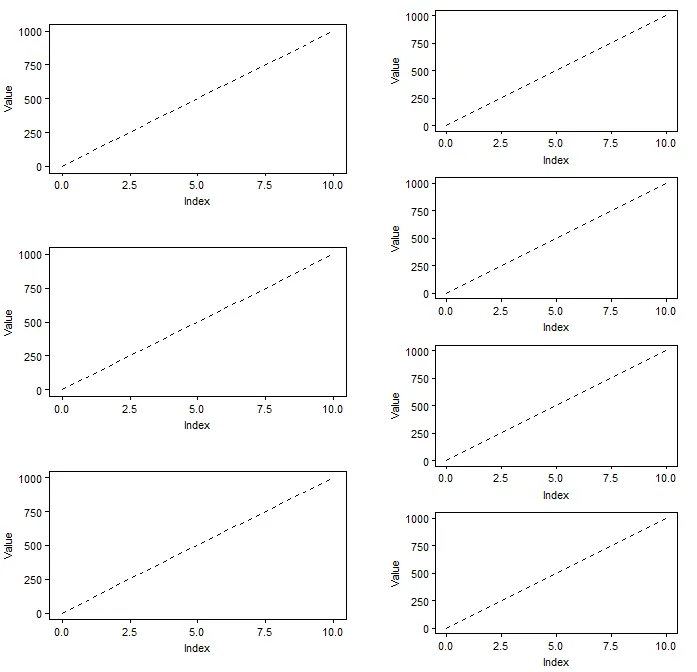
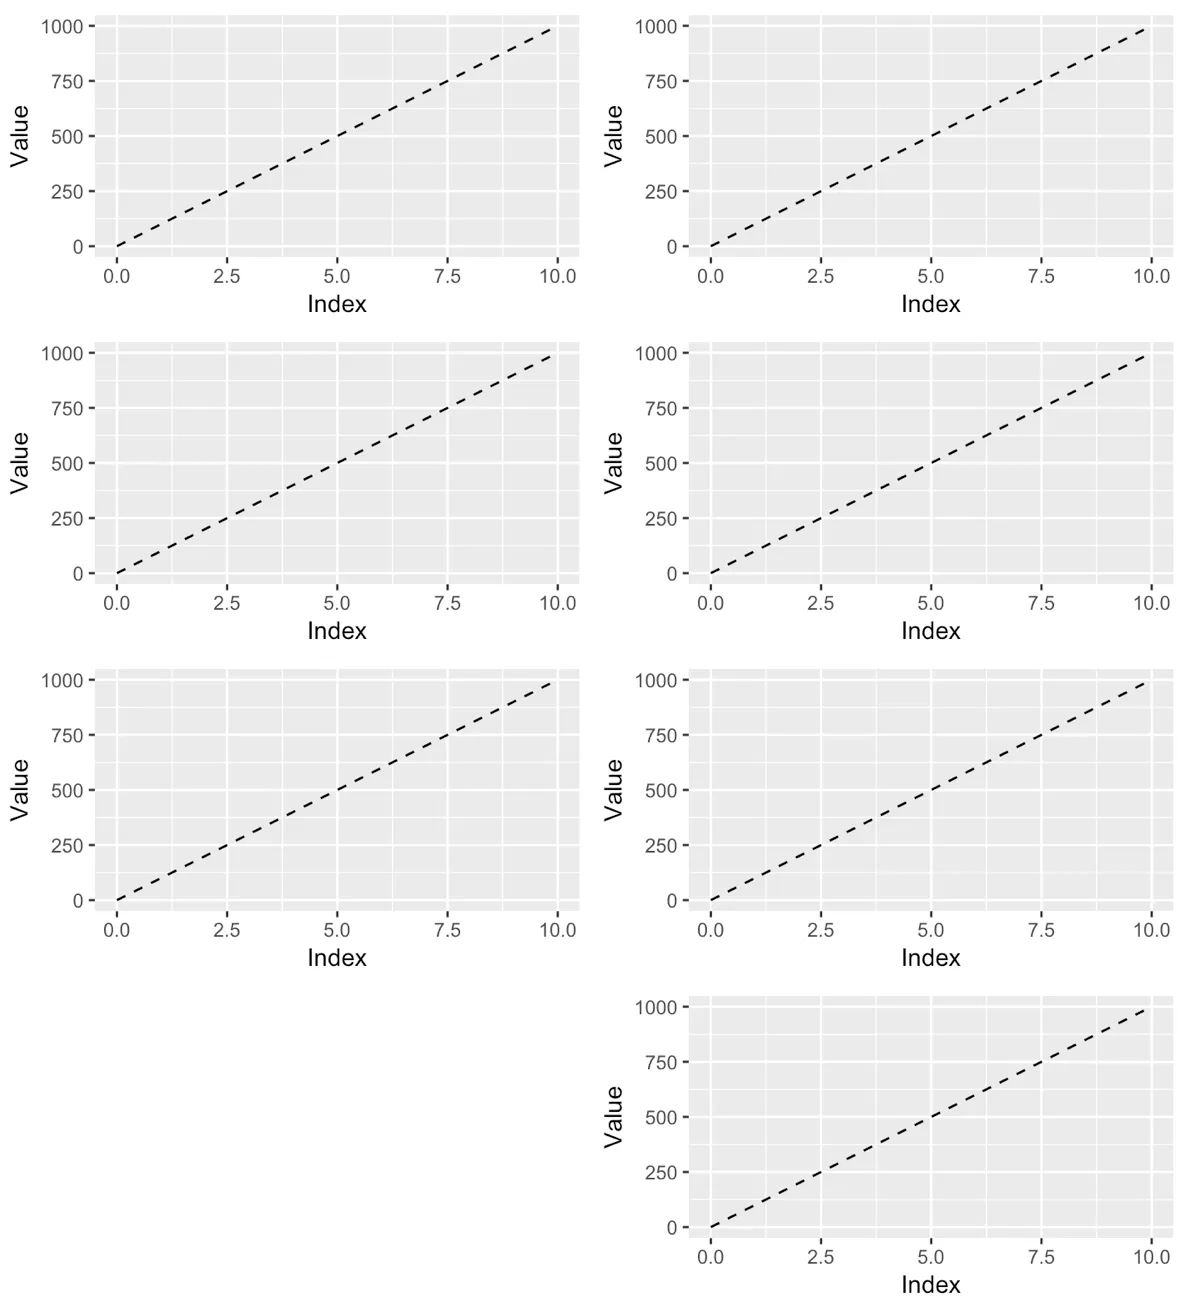
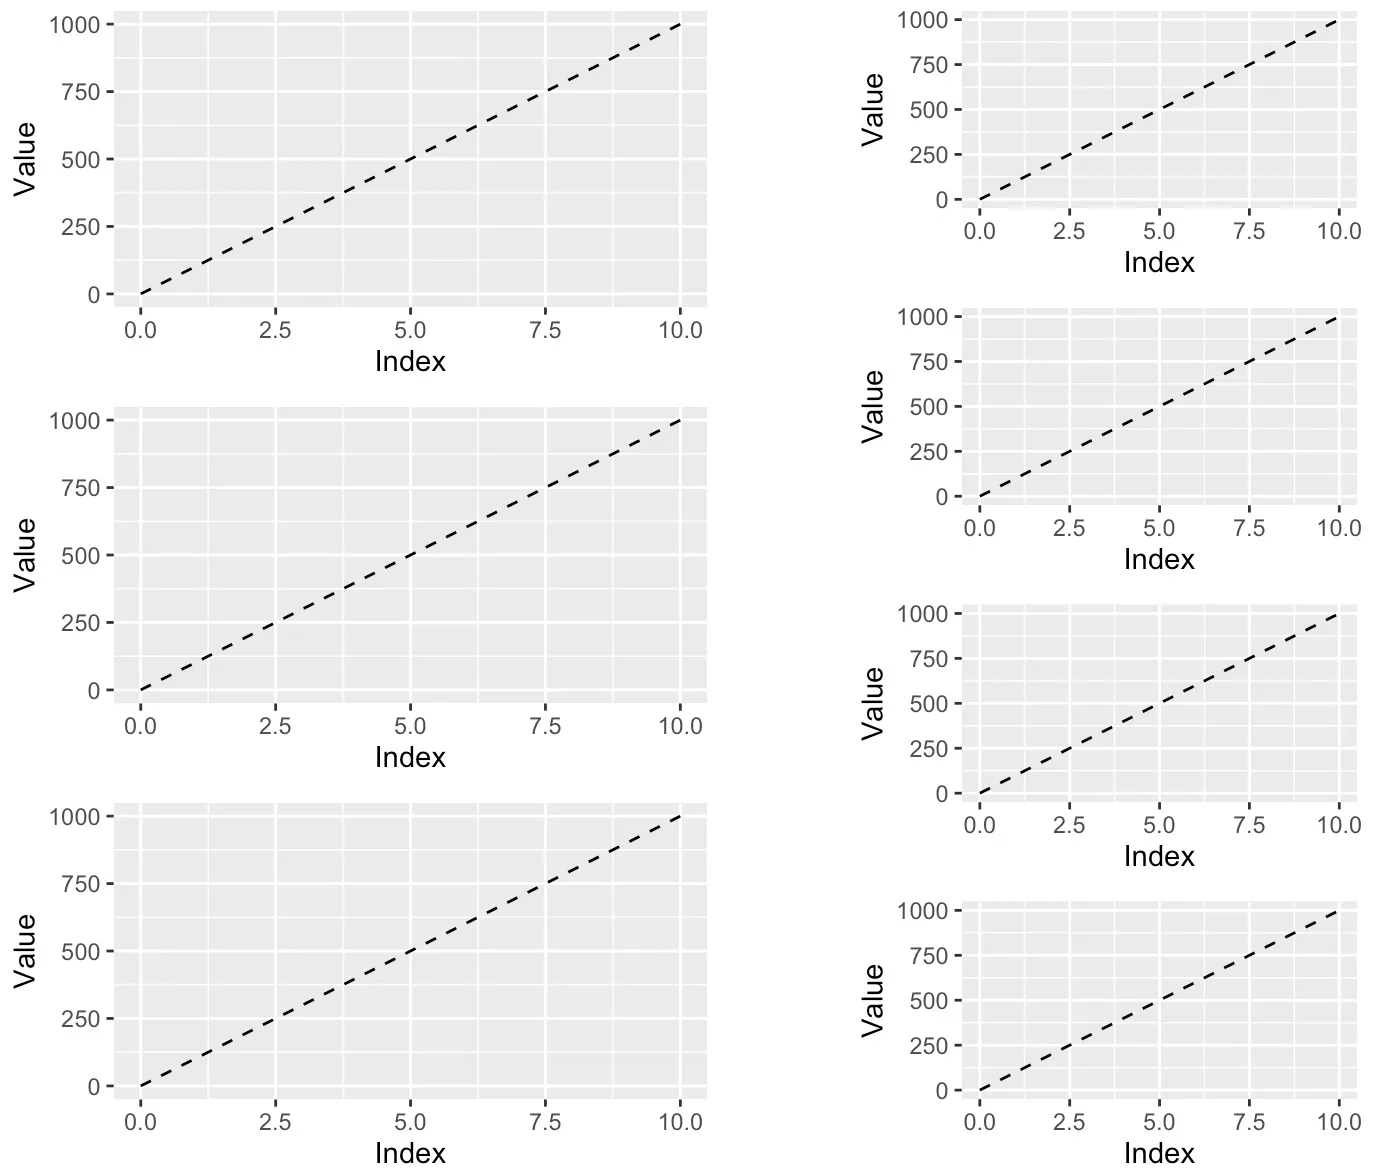
我有7个图表,将它们分成两列,一列有3个图表,另一列有4个图表。我使用cowplot中的plot_grid实现。结果几乎完美,但是3个图表的那一列图表较大。如何缩放该列以使所有图表大小相同,并对齐每列的第一个和最后一个图表?
library(ggplot2)
library(cowplot)

Value <- seq(0,1000, by = 1000/10)
Index <- 0:10
DF <- data.frame(Index, Value)

plot1 <- ggplot(DF, aes(x = Index, y = Value)) +
  geom_line(linetype = 2) +
  theme(aspect.ratio = 0.5)

plot2 <- ggplot(DF, aes(x = Index, y = Value)) +
  geom_line(linetype = 2) +
  theme(aspect.ratio = 0.5)

plot3 <- ggplot(DF, aes(x = Index, y = Value)) +
  geom_line(linetype = 2) +
  theme(aspect.ratio = 0.5)

plot4 <- ggplot(DF, aes(x = Index, y = Value)) +
  geom_line(linetype = 2) +
  theme(aspect.ratio = 0.5)

plot5 <- ggplot(DF, aes(x = Index, y = Value)) +
  geom_line(linetype = 2) +
  theme(aspect.ratio = 0.5)

plot6 <- ggplot(DF, aes(x = Index, y = Value)) +
  geom_line(linetype = 2) +
  theme(aspect.ratio = 0.5)

plot7 <- ggplot(DF, aes(x = Index, y = Value)) +
  geom_line(linetype = 2) +
  theme(aspect.ratio = 0.5)

col1 <- plot_grid(plot1, plot2, plot3, align = "v", ncol = 1)
col2 <- plot_grid(plot4, plot5, plot6, plot7, align = "v", ncol = 1)
plot_grid(col1, col2, ncol = 2, align = "hv")
 }}
}}
cowplot的一个很好的增强功能 :) - pat-s