我编写了一些代码,可以跟随附图中显示的黑色边缘。每次选择下一个点时,图形将重新绘制以显示更新。这样做是为了以动画方式演示代码。
function draw_point2(BinaryImage, P, P_r, P_c)
%P is a 1x2 array for the position of the current black pixel.
%P_r is nx1 list of all the row values for the detected pixels.
%P_c is nx1 list of all the column values for the detected pixels.


    cla
    r = P(1,1);
    c = P(1,2);
    figure (100)
    imshow(BinaryImage) , title('Binary image')
    hold on;
    plot(P_c, P_r, 'c.', 'LineWidth', 2); hold on
    %Current Black Pixel
    plot(c, r, 'c.', 'LineWidth', 2); hold on;

    % Possible Black Pixel - Next
    plot(c, r+1, 'rs', 'LineWidth', 2); hold on
    plot(c, r-1, 'rs', 'LineWidth', 2); hold on
    plot(c-1, r, 'rs', 'LineWidth', 2); hold on
    plot(c+1, r, 'rs', 'LineWidth', 2); hold on
    plot(c-1, r+1, 'rs', 'LineWidth', 2); hold on
    plot(c-1, r-1, 'rs', 'LineWidth', 2); hold on
    plot(c+1, r+1, 'rs', 'LineWidth', 2); hold on
    plot(c+1, r-1, 'rs', 'LineWidth', 2); hold on
    axis equal
    truesize;
end
谢谢
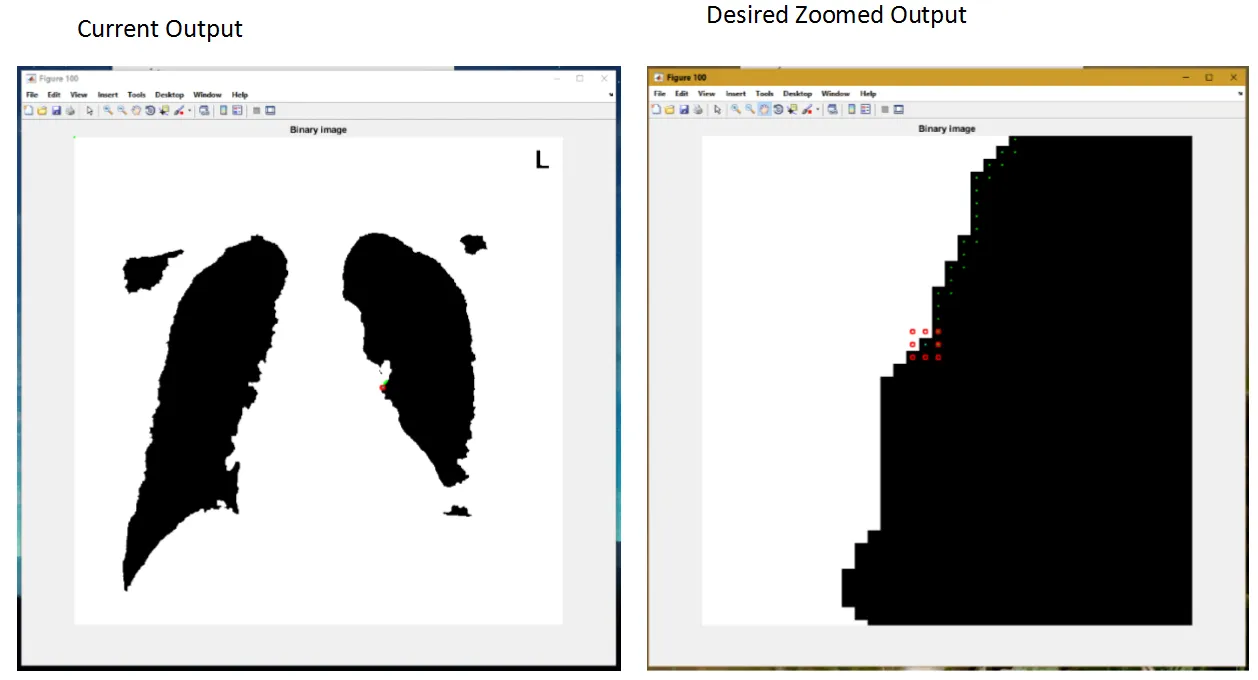
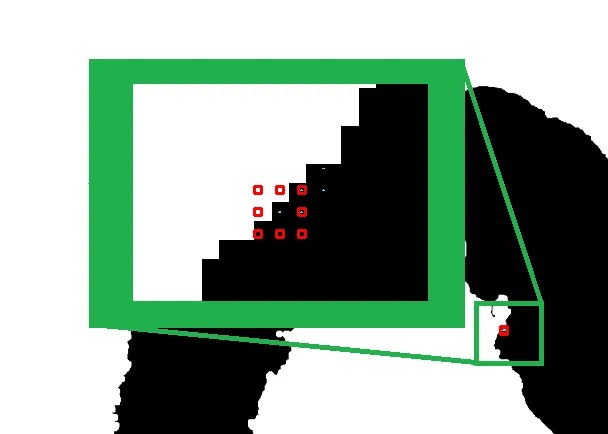
编辑1
下面的图片展示了期望输出和当前输出的对比。(它展示了我希望绘制的图形效果。它显示了兴趣点(POI)的缩放比例和中心位置。在理想情况下,POI也应该始终居中于图形中。