使用 patchwork 包非常简单明了。
另外,不要忘记 facet 选项 - 这需要使用 ggh4x 包。
最后,还有期望的 cowplot 解决方案,它需要将多个 plot_grid 对象复杂嵌套。 不是我喜欢的。
library(ggplot2)
library(patchwork)
df <- data.frame(
x = 1:10, y1 = 1:10, y2 = (1:10)^2, y3 = (1:10)^3, y4 = (1:10)^4
)
make_p <- function(y){
ggplot(df, aes(x, !!sym(y))) + geom_point()
}
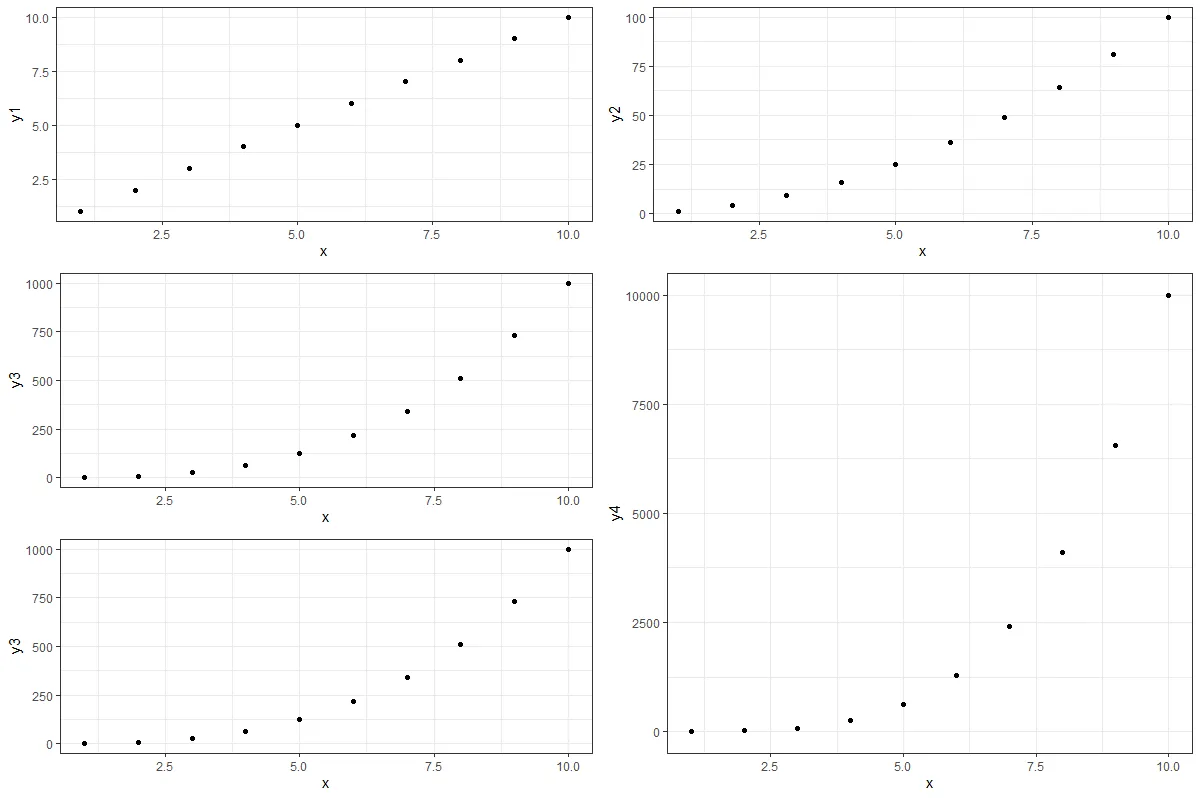
layout <- "
AB
CD
ED
"
ls_p <- lapply(paste0("y", c(1:4,3)), make_p)
wrap_plots(ls_p) + plot_layout(design = layout)

在您的特定示例中,另一个选项是利用 ggh4x::facet_manual。
library(tidyverse)
library(ggh4x)
df <- data.frame(
x = 1:10, y1 = 1:10, y2 = (1:10)^2, y3 = (1:10)^3, y4 = (1:10)^4,
y5 = (1:10)^3
)
design <- "
AB
CD
ED
"
df %>%
pivot_longer(matches("^y")) %>%
ggplot(aes(x, value)) +
geom_point() +
facet_manual(~ name, design)

最后,cowplot选项。
library(cowplot)
p1 <- ggplot(df, aes(x, y1)) + geom_point()
p2 <- ggplot(df, aes(x, y2)) + geom_point()
p3 <- ggplot(df, aes(x, y3)) + geom_point()
p4 <- ggplot(df, aes(x, y4)) + geom_point()
p5 <- ggplot(df, aes(x, y3)) + geom_point()
top_row <- plot_grid(p1, p2)
left_col <- plot_grid(p3, p5, ncol = 1)
bottom_panel <- plot_grid(left_col, p4, ncol = 2)
plot_grid(top_row, bottom_panel, ncol = 1)

cowplot是否必要?patchwork包可能会有所帮助。 - Peter