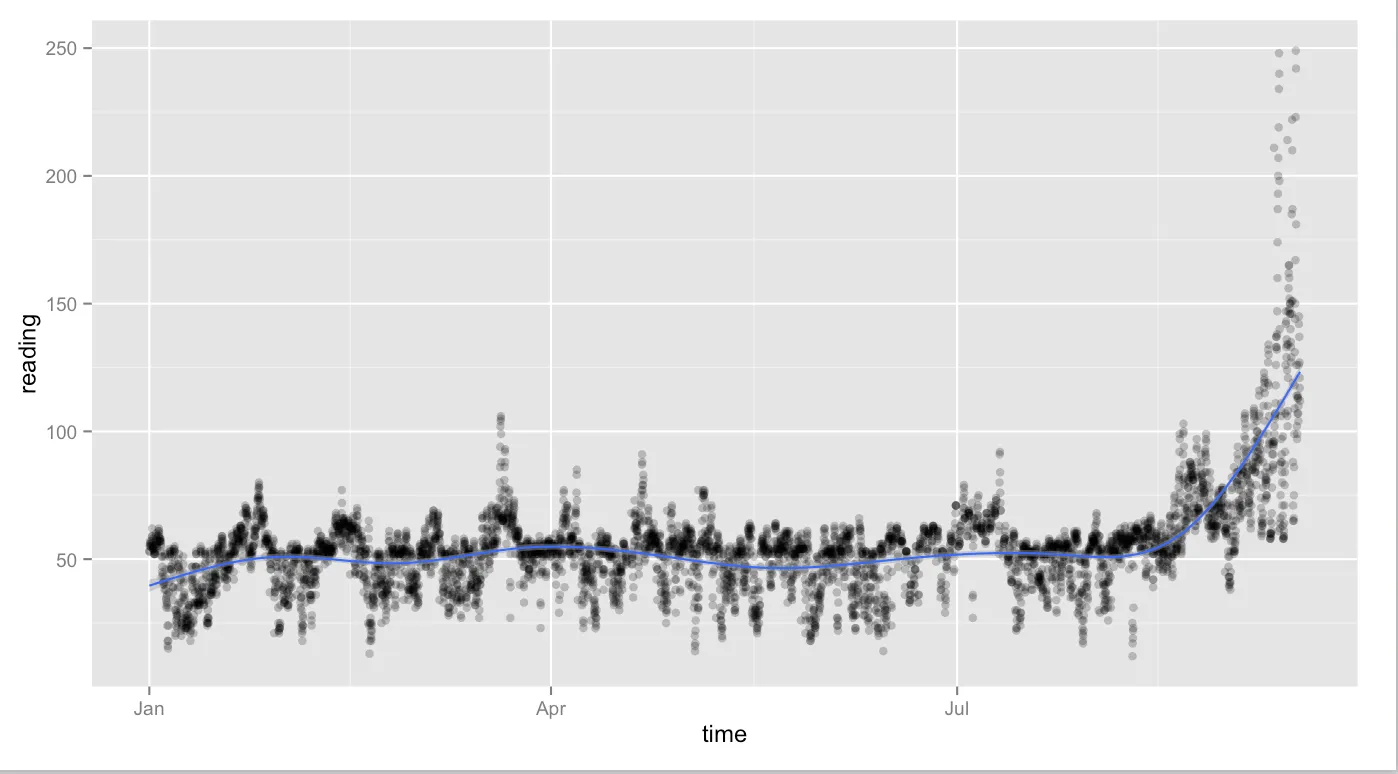
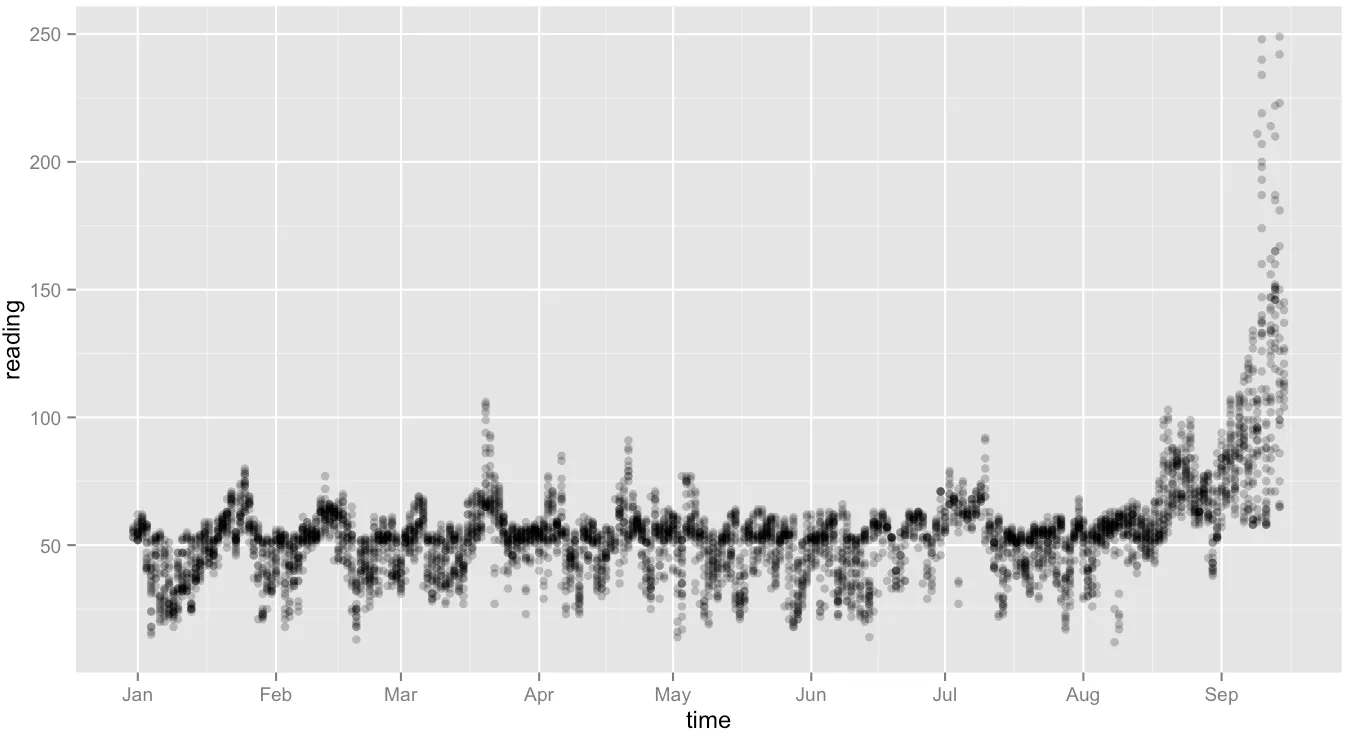
我正在尝试为这张图表的x轴添加刻度,以显示一年中的所有月份:
我的代码如下:
library(ggplot2)
library(scales)
p <- ggplot(df_test, aes(time, reading))
p + geom_point(alpha = 1/4) + geom_smooth()
我尝试使用scale_x_date,但遇到了以下错误:
Error: Invalid input: date_trans works with objects of class Date only
这是我正在使用的数据框:
 hour   reading   date                time
 1      53        1/1/15 2015-01-01 01:00:00
 2      55        1/1/15 2015-01-01 02:00:00
 3      56        1/1/15 2015-01-01 03:00:00
我的时间变量的类:
class(df_test$time) "POSIXct" "POSIXt"

df_test$time的类是什么? - jlhowarddput(df_test),并输入以下代码class(df_test$time)。 - jlhowarddput(head(df_test, 100))命令。或者您可以将数据集上传到某个地方并发布链接,但在这种情况下可能有些过度。无论如何,我的回答是否解决了您的问题?对于scale_x_date(...),POSIXct不应该是问题。 - jlhoward