使用cowplot和ggplot2在特定行周围绘制边框

8
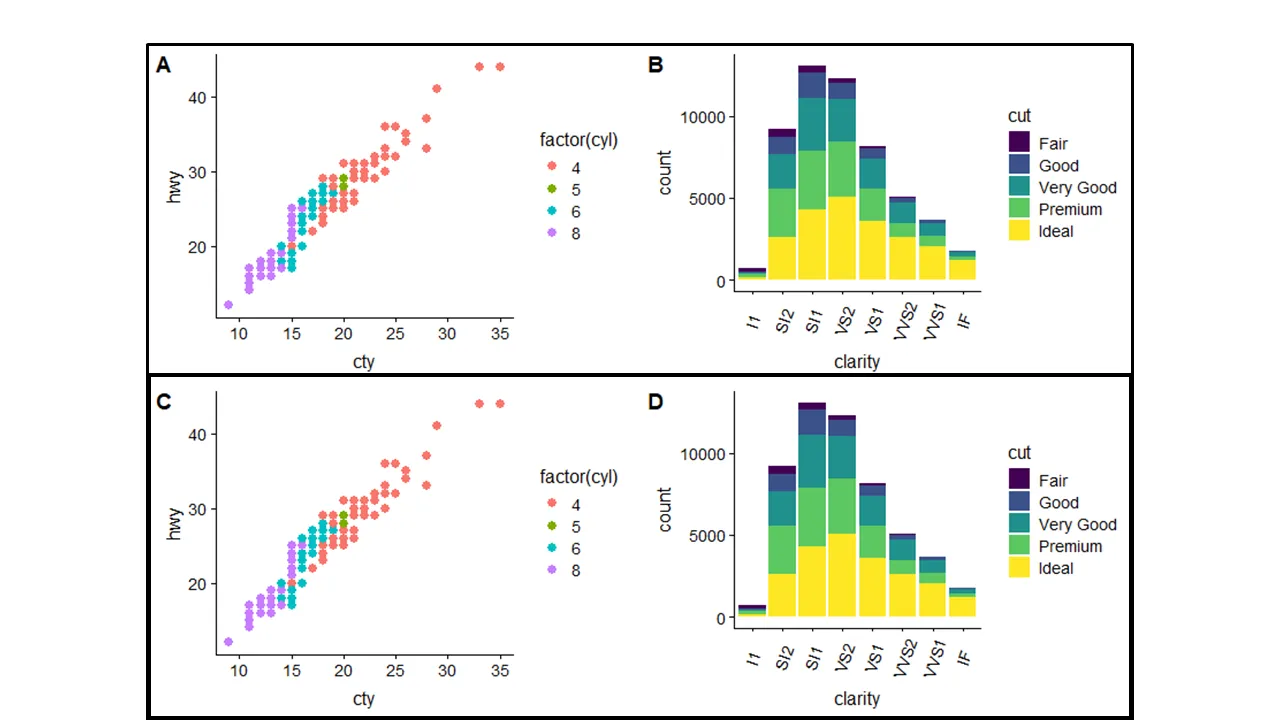
我希望能够在一个多面板图中标注出需要进行比较的特定行。例如,我想制作这个图表:

enter image description here

请看这个图(由PowerPoint制作的带有面板框):

enter image description here

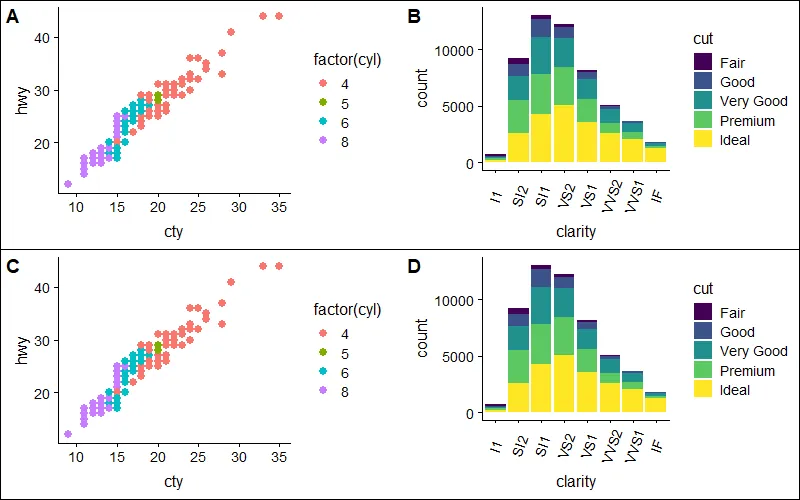
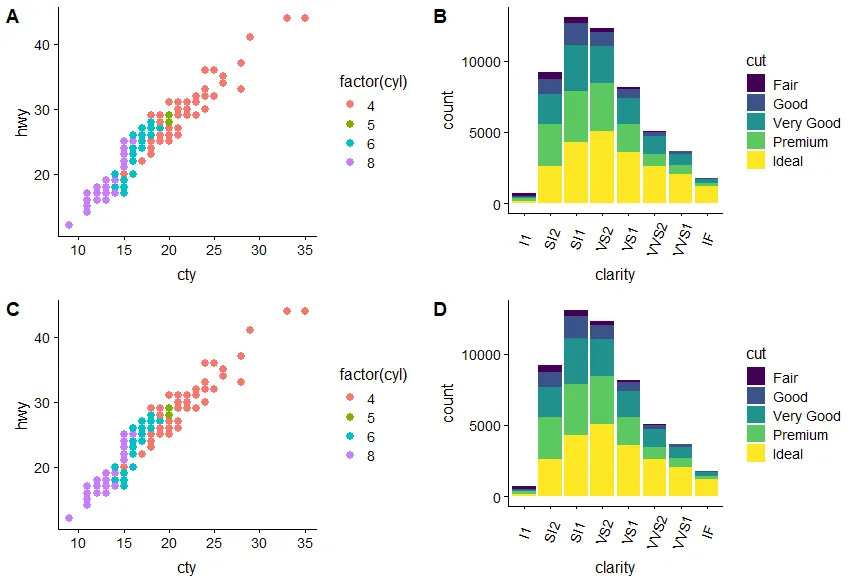
这是我编写的使用第一个图的代码。我使用了ggplot和cowplot:

require(cowplot)
theme_set(theme_cowplot(font_size=12)) # reduce default font size
plot.mpg <- ggplot(mpg, aes(x = cty, y = hwy, colour = factor(cyl))) + 
  geom_point(size=2.5)
plot.diamonds <- ggplot(diamonds, aes(clarity, fill = cut)) + geom_bar() +
  theme(axis.text.x = element_text(angle=70, vjust=0.5))
plot.mpg2 <- ggplot(mpg, aes(x = cty, y = hwy, colour = factor(cyl))) + 
  geom_point(size=2.5)
plot.diamonds2 <- ggplot(diamonds, aes(clarity, fill = cut)) + geom_bar() +
  theme(axis.text.x = element_text(angle=70, vjust=0.5))
plot_grid(plot.mpg, plot.diamonds,plot.mpg2, plot.diamonds2, nrow=2,labels = c('A', 'B','C','D'))

我能否修改这段代码以获得所需的边框?或者,我是否可以使面板A和B的颜色与面板C和D的背景略有不同?那可能会更好。


可能与 https://stackoverflow.com/q/36963349/3358272 相关。 - r2evans
似乎相关,但我仍然不确定如何仅在多面板图中放置特定行周围的边框。该帖子似乎适用于在整个图形周围放置边框。 - user2917781
是的,这就是为什么我建议使用“相关”,而不是确定重复。很抱歉,我没有更多的信息,但我的猜测是你需要深入了解grobs和其他内容,而不是仅限于ggplot2本身。 - r2evans
这个答案在我的情况下比上面的那个更好: https://stackoverflow.com/questions/58429757/draw-box-around-a-grid-of-plots-in-r - Vicky Ruiz
1个回答

14

由于plot_grid()的结果是一个ggplot对象,因此一种方法是使用嵌套的绘图网格:每行一个plot_grid(),通过theme()添加相应的边框。

plot_grid(
  # row 1
  plot_grid(plot.mpg, plot.diamonds, nrow = 1, labels = c('A', 'B')) +
    theme(plot.background = element_rect(color = "black")),

  # row 2
  plot_grid(plot.mpg2, plot.diamonds2, nrow = 1, labels = c('C', 'D')) +
    theme(plot.background = element_rect(color = "black")), 

  nrow = 2)

plot


网页内容由stack overflow 提供, 点击上面的
可以查看英文原文,
原文链接