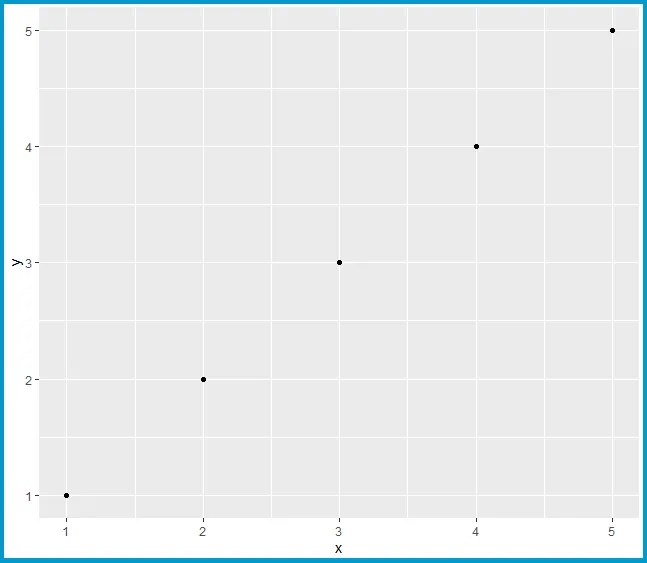
我希望在整个ggplot2图形周围绘制一个边框,就像Base R图中的box("figure")函数所做的那样。
请查看以下示例:
请查看以下示例:
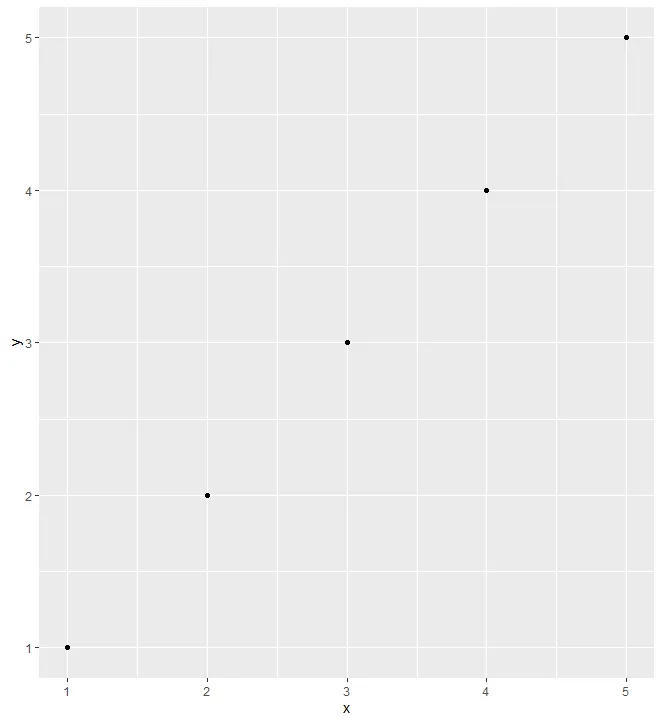
data <- data.frame(x = 1:5,
                   y = 1:5)

library("ggplot2")

ggplot(data, aes(x, y)) +
  geom_point()
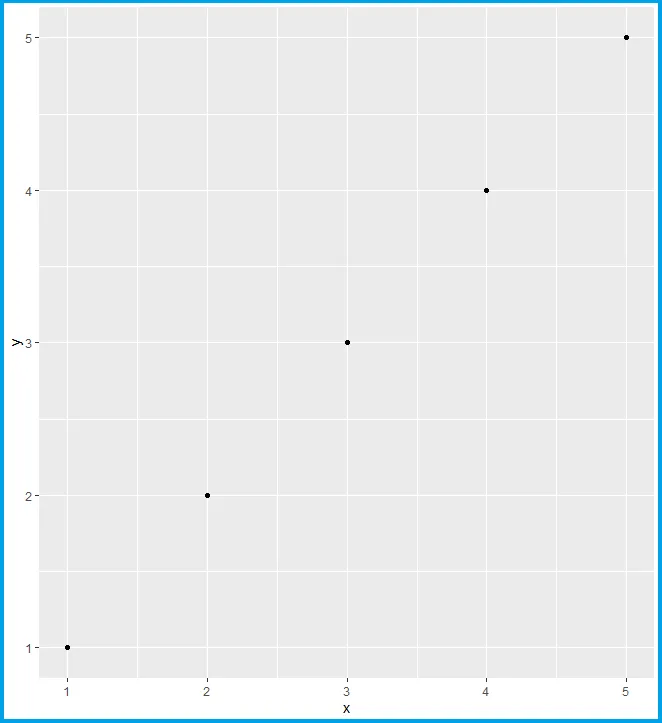
我无法相信这些信息在任何地方都不存在。不幸的是,我只找到了如何添加面板边框。
我应该如何在整个ggplot2图形周围添加边框?