在ggplot2中为每个facet_wrap网格放置一个图例。

34

我有这个数据框:

x <- data.frame(
  Date = factor(rep(
    c("12/1/2011", "1/2/2012", "2/1/2012", "2/10/2012", "2/13/2012"),
    3
  )),
  Server = factor(rep(c("A", "B", "C"), each = 5L)),
  FileSystem = factor(c(
    "/", "/var", "tmp", "/db", "/app", "C:", "D:", "F:", "/restore",
    "G:", "/", "/tmp", "/data", "/Storage", "/database"
  )),
  PercentUsed = c(
    60L, 50L, 90L, 86L, 90L, 67L, 67L, 34L, 89L, 56L, 90L, 78L,
    67L, 34L, 12L
  )
)
x
#>         Date Server FileSystem PercentUsed
#> 1  12/1/2011      A          /          60
#> 2   1/2/2012      A       /var          50
#> 3   2/1/2012      A        tmp          90
#> 4  2/10/2012      A        /db          86
#> 5  2/13/2012      A       /app          90
#> 6  12/1/2011      B         C:          67
#> 7   1/2/2012      B         D:          67
#> 8   2/1/2012      B         F:          34
#> 9  2/10/2012      B   /restore          89
#> 10 2/13/2012      B         G:          56
#> 11 12/1/2011      C          /          90
#> 12  1/2/2012      C       /tmp          78
#> 13  2/1/2012      C      /data          67
#> 14 2/10/2012      C   /Storage          34
#> 15 2/13/2012      C  /database          12
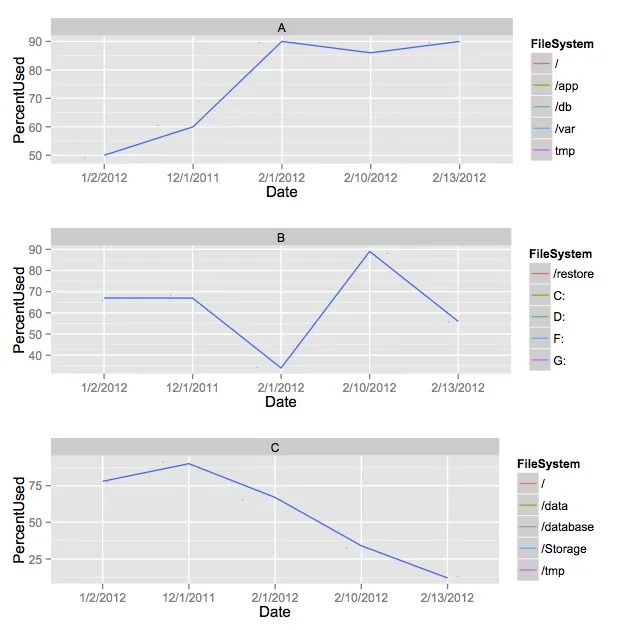
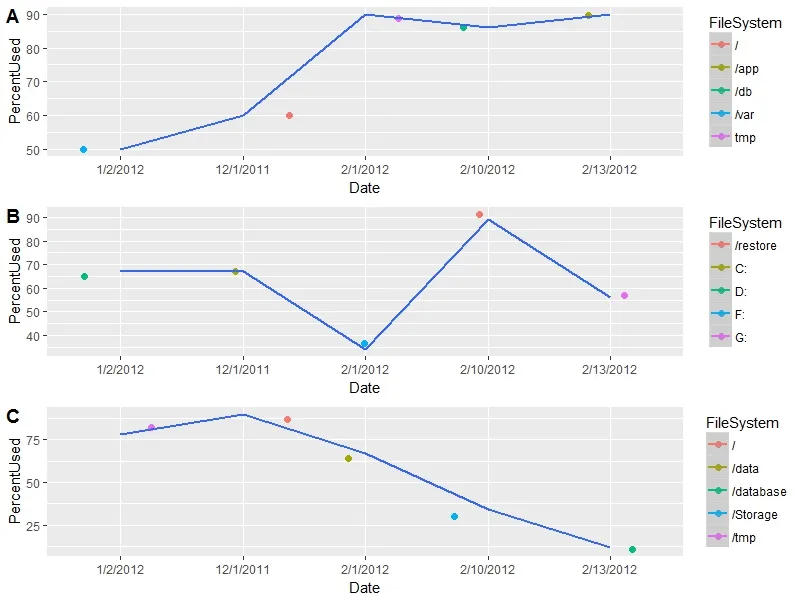
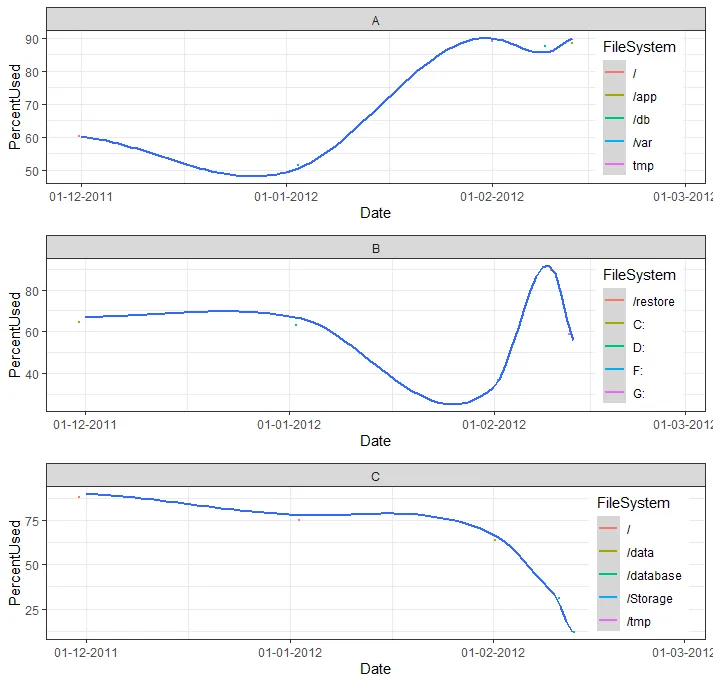
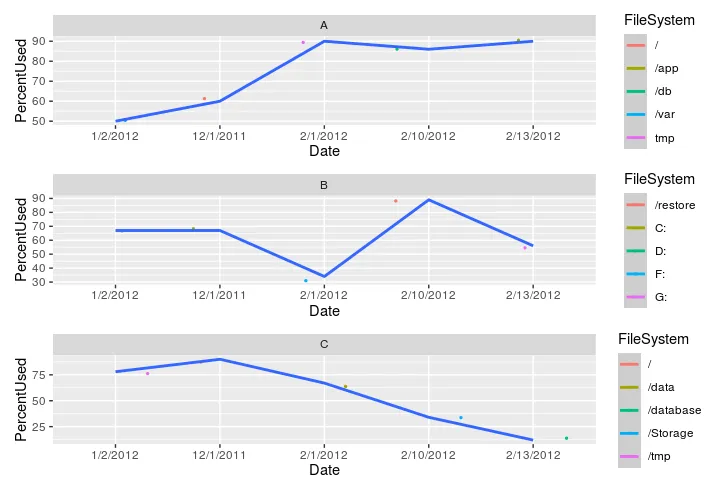
我想在每个facet_wrap网格旁边放置一个图例,它自己的FileSystem
当我这样做时,它会将图例放在所有FileSystem的图的一侧。是否可能将每个服务器的FileSystem放在每个网格旁边?
ggplot(x, aes(Date, PercentUsed, group=1, colour=FileSystem)) + 
     geom_jitter(size=0.5) + geom_smooth(method="loess", se=T) + 
     facet_wrap(~Server, ncol=1)
5个回答

33

最好的方法是使用 gridExtra 包:

library(gridExtra)

xs <- split(x,f = x$Server)
p1 <- ggplot(xs$A,aes(x = Date,y = PercentUsed,group = 1,colour = FileSystem)) + 
        geom_jitter(size=0.5) + 
        geom_smooth(method="loess", se=T) + 
        facet_wrap(~Server, ncol=1)

p2 <- p1 %+% xs$B
p3 <- p1 %+% xs$C

grid.arrange(p1,p2,p3)

enter image description here


我应该指出,在
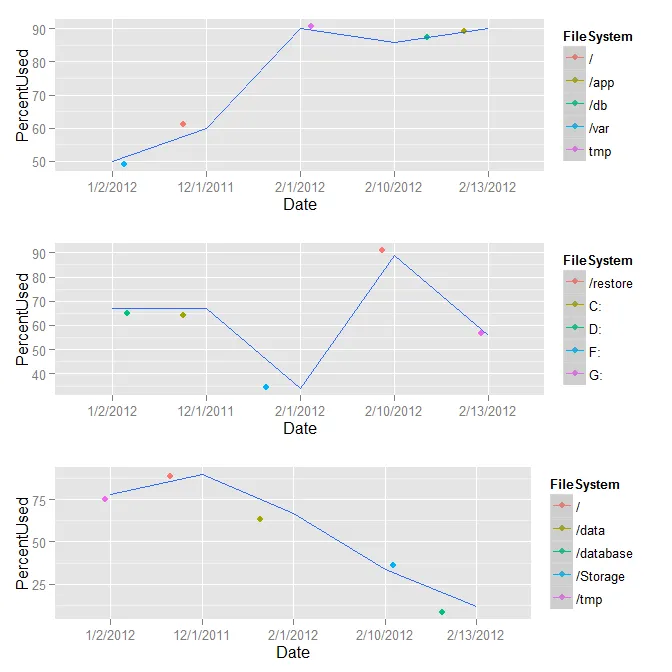
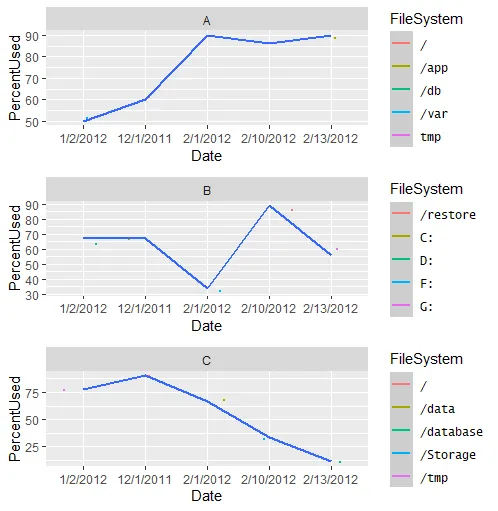
geom_jitter中,您将点的大小设置得非常小,我不确定为什么,但我将其保留为原样。点确实存在,但很难看到。 - joran
4
我对%+%运算符有些好奇。你能不能解释一下它是什么? - Legend
6
这是一种使 ggplot 对象“模块化”的方法,意味着您可以使用它来轻松地插入新的数据框,但使用之前绘图中的所有几何规范。当然,只有在列名称完全匹配并且您没有在其他层中使用任何其他数据框时,它才能正常工作。 - joran
+1 谢谢您的及时回复。这是一种很棒的重复使用对象的方式! - Legend
1
@joran,你如何使网格中的每个图形占据相等的空间,以便它们的x刻度对齐? - lgd
显示剩余2条评论

33

啊,@joran 比我更快地完成了这个任务(我的 gridExtra 已经过时了,但我花了 10 分钟才意识到)。这里有一个类似的解决方案,但是它通过在 Server 中的级别上通用的方式来实现同样的效果。

library(gridExtra)
out <- by(data = x, INDICES = x$Server, FUN = function(m) {
      m <- droplevels(m)
      m <- ggplot(m, aes(Date, PercentUsed, group=1, colour = FileSystem)) + 
         geom_jitter(size=2) + geom_smooth(method="loess", se=T)
   })
do.call(grid.arrange, out)

# If you want to supply the parameters to grid.arrange
do.call(grid.arrange, c(out, ncol=3))

image


非常好。我没有意识到droplevels()有一个适用于data.frame的方法。这很方便! - Josh O'Brien
1
有没有一种简洁的方法来强制对齐,即保持绘图区域的宽度相同?指定图例的宽度? - mlt
@mlt 考虑将图例移到第一个图的顶部,并从其他图中删除它。 - Roman Luštrik
事实上,与此同时,我最终将所有图例都移到了顶部。由于每个图都是唯一的,因此我无法使用单个图例。不过,如果有一种指定宽度的方法,那就太好了。 - mlt
@mlt 考虑提出一个新问题,尽管据我所知这是不可能的(不过可以定义边距)。 - Roman Luštrik
@mlt,请查看下面我的建议。 - Nova

15

不使用facets,我们可以为每个组制作一个图形列表,然后使用cowplot::plot_grid进行绘图。每个图形将有自己的图例:

# make list of plots
ggList <- lapply(split(x, x$Server), function(i) {
  ggplot(i, aes(Date, PercentUsed, group = 1, colour = FileSystem)) + 
    geom_jitter(size = 2) +
    geom_smooth(method = "loess", se = TRUE)})

# plot as grid in 1 columns
cowplot::plot_grid(plotlist = ggList, ncol = 1,
                   align = 'v', labels = levels(x$Server))
根据@Axeman的建议,我们可以使用facet_grid(〜Server)来添加标签,而不是labels = levels(x $ Server)

enter image description here


3
我喜欢@joran的答案,并提供了一些选项,以他们的代码为起点。 这两个选项都解决了错位facet的问题。

图例在facet之外

如果您选择使用等宽字体作为图例项,您可以使用str_pad在所有图例条目的右侧添加填充,从而强制每个条目的长度保持一致。

如果您愿意使用等宽字体,这是一个快速修复。

library(ggplot2)
library(dplyr)
library(gridExtra)
library(stringr)

l <- max(nchar(as.character(x$FileSystem)))
mylevels <- as.character(levels(x$FileSystem))
mylevels <- str_pad(mylevels, width = l, side = "right", pad = " ")
x <- mutate(x, FileSystem = factor(str_pad(FileSystem, width = l, side = "right", pad = " "),
            levels = mylevels))
windowsFonts("Lucida Sans Typewriter" = windowsFont("Lucida Sans Typewriter"))
xs <- split(x,f = x$Server)
p1 <- ggplot(xs$A,aes(x = Date,y = PercentUsed,group = 1,colour = FileSystem)) + 
  geom_jitter(size=0.5) + 
  geom_smooth(method="loess", se=T) + 
  facet_wrap(~Server, ncol=1) +
  theme(legend.text = element_text(family = "Lucida Sans Typewriter"))

p2 <- p1 %+% xs$B
p3 <- p1 %+% xs$C

grid.arrange(p1,p2,p3)

enter image description here

分面内的图例

如果您不介意在每个分面内添加图例,可以使用scale调用中的“expand”参数为每个分面添加额外的空间:

library(lubridate)
x <- mutate(x, Date = as.Date(as.character(Date), format = "%m/%d/%Y"))
xs <- split(x,f = x$Server)
p1 <- ggplot(xs$A,aes(x = Date,y = PercentUsed,group = 1,colour = FileSystem)) + 
  geom_jitter(size=0.5) + 
  scale_x_date(expand = expansion(add = c(5, 20)),
               date_labels = "%d-%m-%Y") +
  geom_smooth(method="loess", se=T) + 
  facet_wrap(~Server, ncol=1) +
  theme_bw() +
  theme(legend.position = c(0.9, 0.5))

p2 <- p1 %+% xs$B
p3 <- p1 %+% xs$C

grid.arrange(p1,p2,p3)

enter image description here


2
除了gridExtracowplot之外,现在还有patchwork。因此,您可以执行以下操作:
require(ggplot2)
require(patchwork)
# split
dfs = split(df, f = df$Server)
# apply ggplot function and write to list
gg_l = lapply(dfs, function(x) {
  ggplot(x, aes(x = Date,y = PercentUsed, group = 1, colour = FileSystem)) + 
    geom_jitter(size = 0.5) + 
    geom_smooth(method = "loess", se = TRUE) + 
    facet_wrap(~ Server, ncol = 1)
})
# patchwork
wrap_plots(gg_l, ncol = 1)

enter image description here

您可以手动组合绘图,可在此处查看。 我使用了OP的数据df

网页内容由stack overflow 提供, 点击上面的
可以查看英文原文,
原文链接