我正在制作一个包含两个不同映射的图表(“group”映射到颜色和线条类型,“to”映射到形状)。我想将这两个映射合并到一个图例中,但是无法在图例中正确显示形状。
以下是我的尝试:
set.seed(123)
plotdata = cbind.data.frame(x = rep(1:5, times = 4),
y = rnorm(20),
from = rep(c("1","2"), each = 10),
to = rep(c("1","2"), times= 10))
plotdata = cbind.data.frame(plotdata, group = paste0(plotdata$from, "to", plotdata$to))
library(ggplot2)
plot1 = ggplot(plotdata, aes(x = x, y = y, group = group, color = group, lty = group, shape = to)) +
geom_point() + geom_line() + theme_bw() +
scale_color_discrete(name = "",
breaks = c("1to1", "1to2", "2to1", "2to2"),
labels = c("1to1", "1to2", "2to1", "2to2")) +
scale_linetype_discrete(name = "",
breaks = c("1to1", "1to2", "2to1", "2to2"),
labels = c("1to1", "1to2", "2to1", "2to2")) +
scale_shape_manual(name = "",
values = c(1, 2, 1, 2),
breaks = c("1to1", "1to2", "2to1", "2to2"),
labels = c("1to1", "1to2", "2to1", "2to2"))
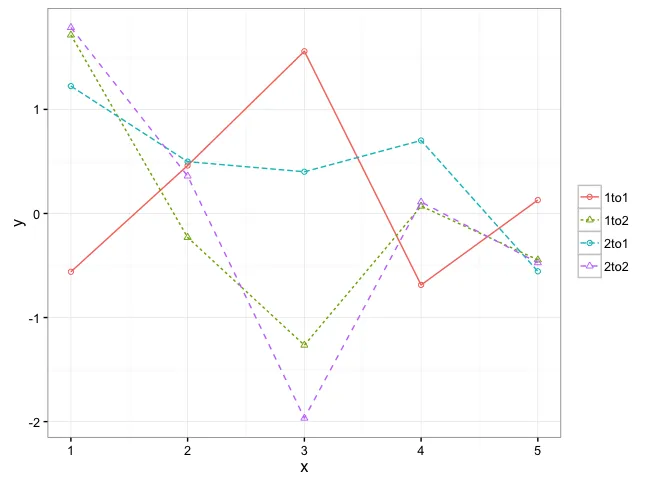
print(plot1)
如您所见,我只有一个图例,但形状始终是圆形。
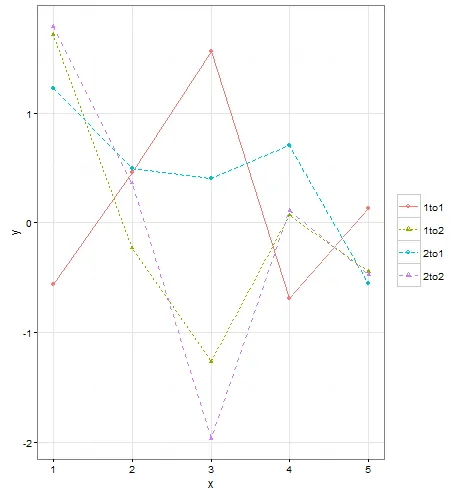
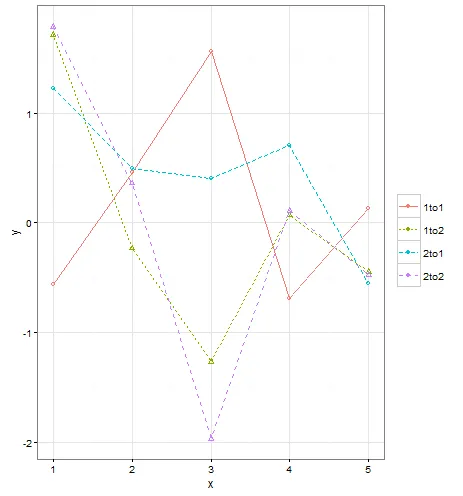
期望的行为:图例中的形状在圆形和金字塔之间交替显示,如图所示。
到目前为止,我尝试手动指定形状,但并没有帮助,如上所示。我还查看了我的绘图对象,希望能够操纵它,但无济于事。