我正在将不同模型的预测线绘制在一些数据点上。我想要一个图例,指示每个点颜色属于哪个个体,另一个图例指示每条线颜色属于哪个模型。以下是一个可重现的虚假示例:
set.seed(123)
df <- data.frame(Height =rnorm(500, mean=175, sd=15),
                 Weight =rnorm(500, mean=70, sd=20),
                 ID = rep(c("A","B","C","D"), (500/4)))

mod1 <- lmer(Height ~ Weight + (1|ID), df)
mod2 <- lmer(Height ~ poly(Weight,2) + (1|ID), df)

y.mod1 <- predict(mod1, data.frame(Weight=df$Weight),re.form=NA) # Prediction of y according to model 1
y.mod2 <- predict(mod2, data.frame(Weight=df$Weight),re.form=NA) # Prediction of y according to model 2

df <- cbind(df, y.mod1,y.mod2)
df <- as.data.frame(df)

head(df)

    Height   Weight ID   y.mod1   y.mod2
1 166.5929 57.96214  A 175.9819 175.4918
2 171.5473 50.12603  B 176.2844 176.3003
3 198.3806 90.53570  C 174.7241 174.7082
4 176.0576 85.02123  D 174.9371 174.5487
5 176.9393 39.81667  A 176.6825 177.7303
6 200.7260 68.09705  B 175.5905 174.8027
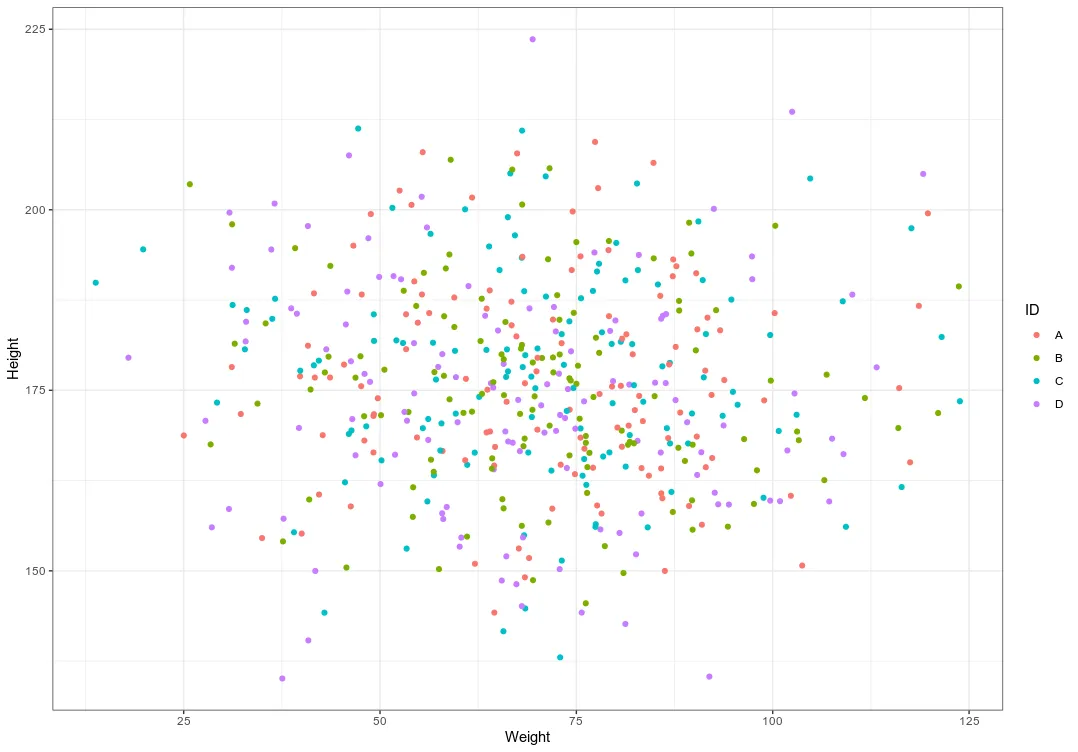
首先,我绘制我的数据点:
Plot_a <- ggplot(df,aes(x=Weight, y=Height,colour=ID)) +
  geom_point() +
  theme_bw() +
  guides(color=guide_legend(override.aes=list(fill=NA)))

Plot_a
Plot_b <- Plot_a +
  geom_line(data = df, aes(x=Weight, y=y.mod1,color='mod1'),show.legend = T) +
  geom_line(data = df, aes(x=Weight, y=y.mod2,color='mod2'),show.legend = T) +
  guides(fill = guide_legend(override.aes = list(linetype = 0)),
         color=guide_legend(title=c("Model")))

Plot_b
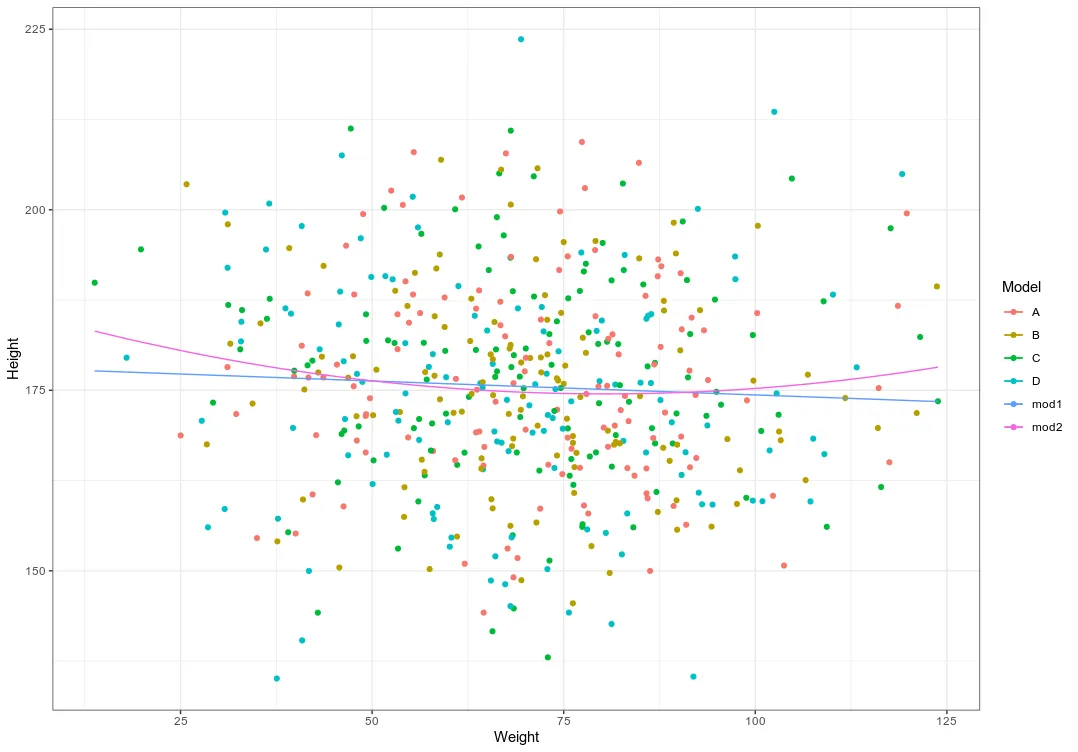
有人知道为什么我没有得到两个不同的图例,一个标题为Model,另一个为ID吗?
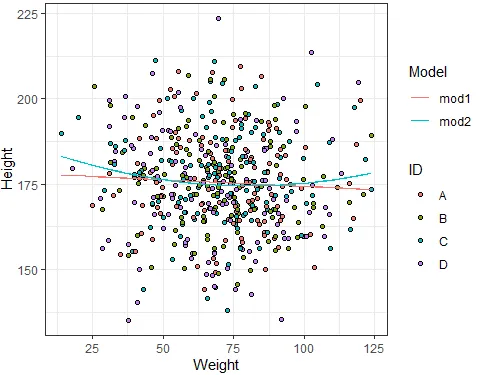
我想要得到这个。
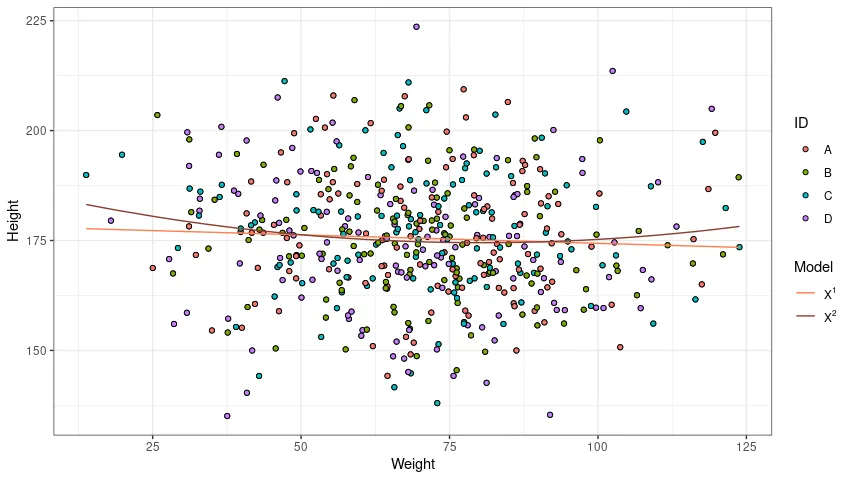

y.mod1和y.mod2改为X¹和X²,我应该在开始时更改变量名吗?此外,在我的实际情况中有5行,所以我认为最好的方法是自定义线条的颜色。我用scale_color_manual()来做这个吗?再次感谢您的时间。 - Dekikescale_color_manual来完成。请参见编辑部分。新颜色只是一个示例。 - Rui Barradas