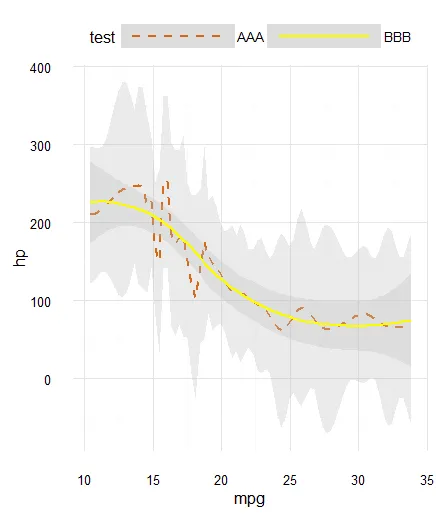
我用 R 和 ggplot2 制作了这个图:
下面是绘制该图的代码:
ggplot(mtcars) +
  geom_smooth(fill='grey', alpha=0.3, span=0.1, aes(x=mpg, y=hp, color='AAA',linetype='AAA')) +
  geom_smooth(fill='grey', alpha=0.3, span=0.9, aes(x=mpg, y=hp, color='BBB',linetype='BBB')) +
  scale_colour_manual(name='test', values=c('AAA'='chocolate', 'BBB'='yellow')) +
  scale_linetype_manual(name='test', values=c('AAA'='dashed','BBB'='solid')) +
  theme_minimal() +theme(legend.position = "top")
问题:从图例中,由于框太小,很难理解“AAA”线是虚线。
我该怎么放大它呢?
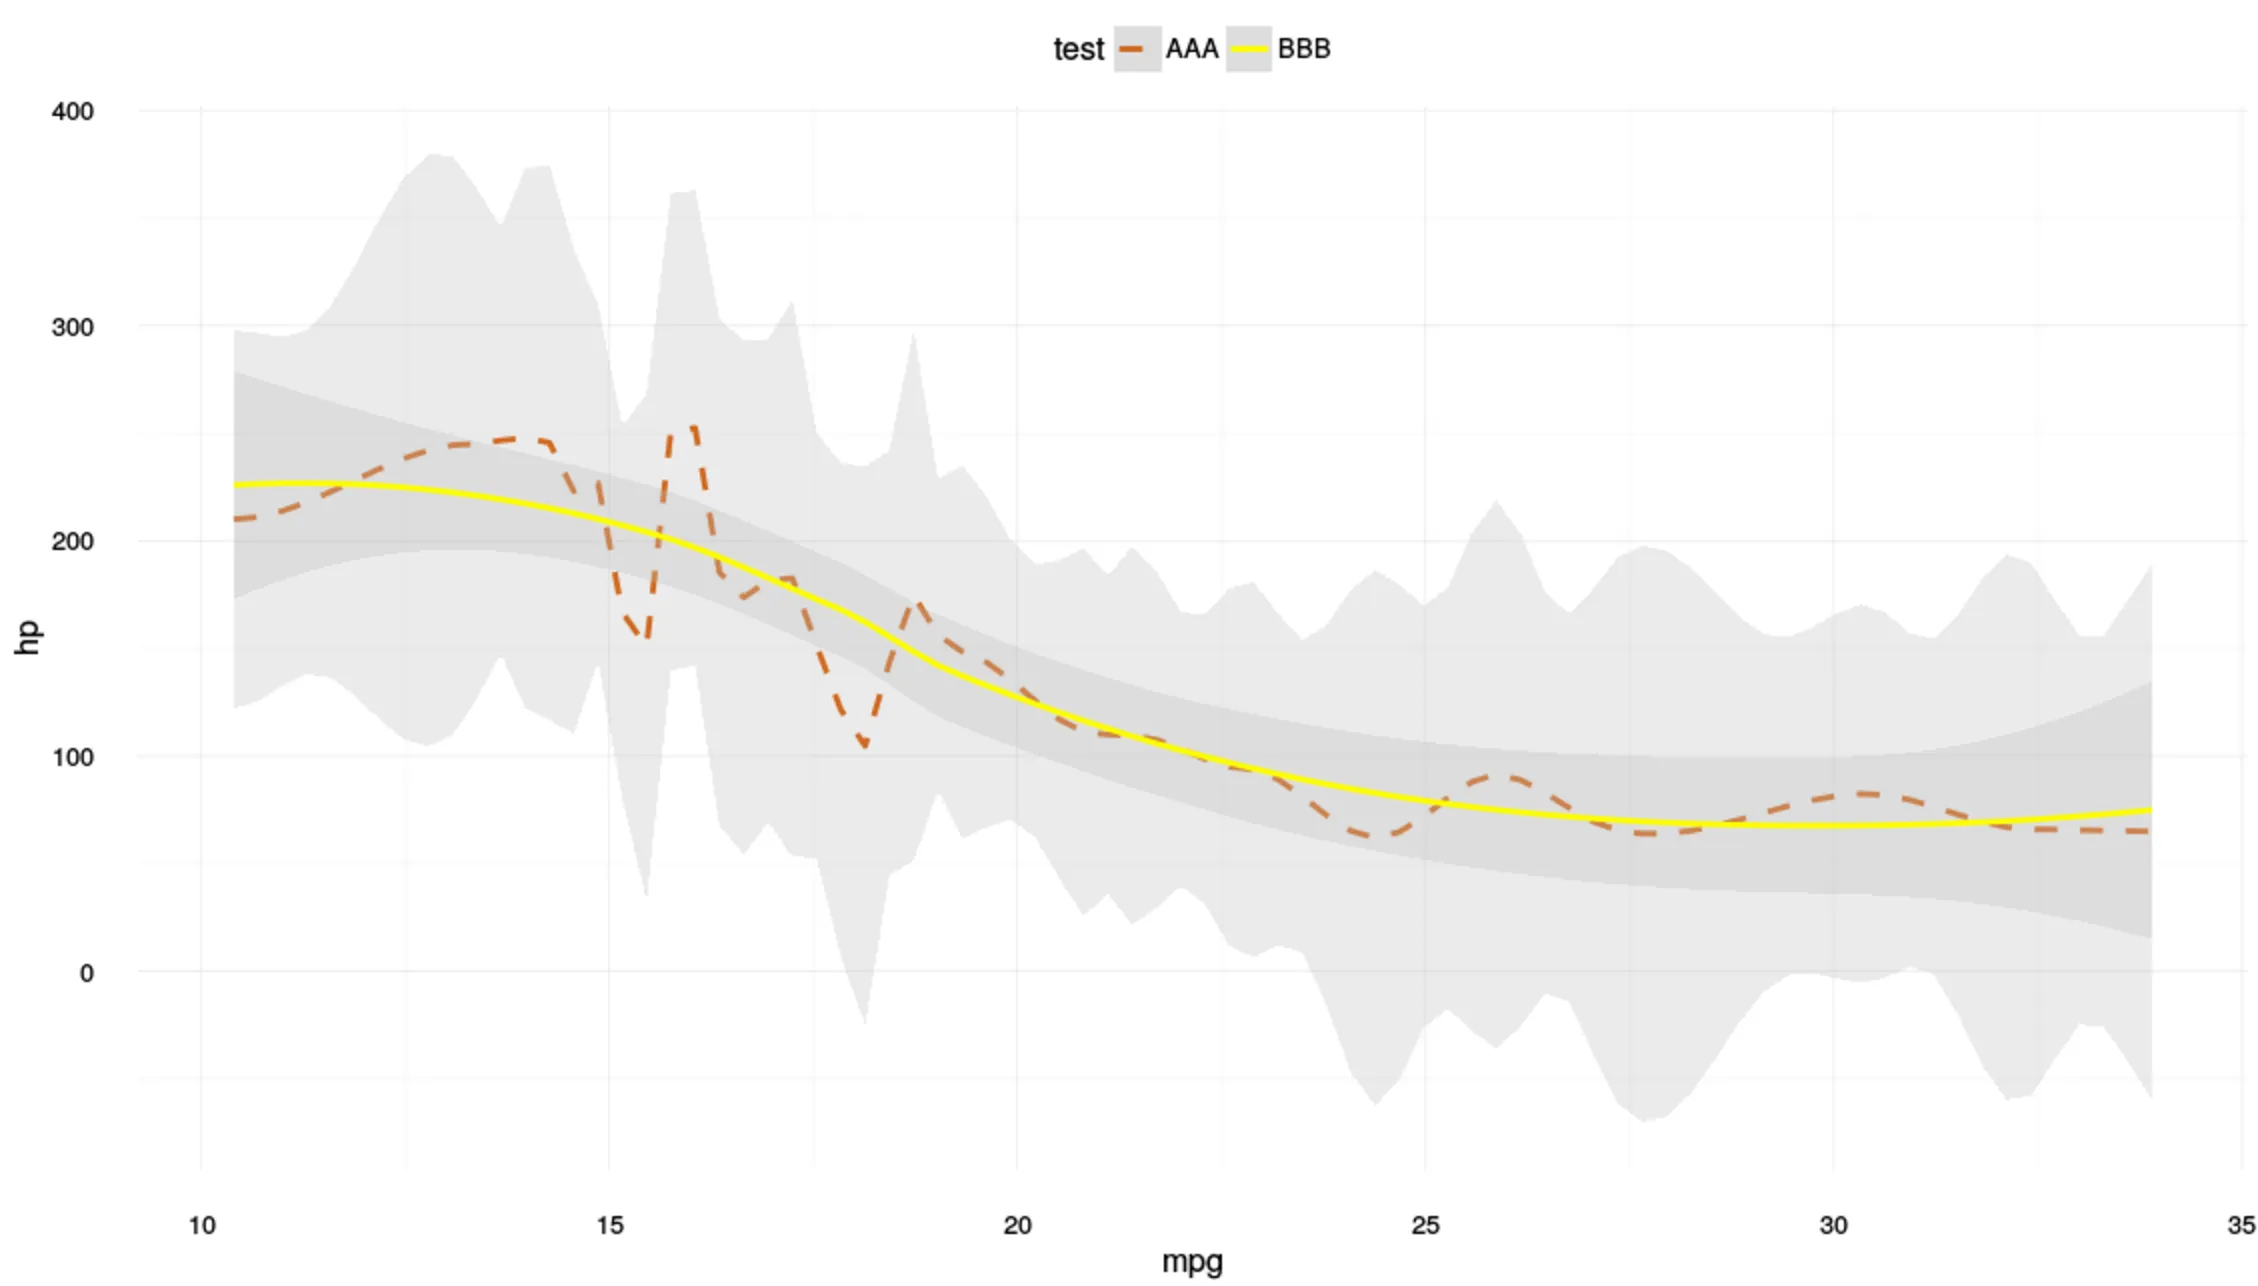
我希望有类似下图的效果: