网格图 + tikzDevice + 共享带有Latex标记的图例

5
我一直在尝试跟进这个范例,了解如何为多个ggplot2制作共享图例。给定的示例完美地按原样工作,但在我的情况下,我使用tikzDevice导出tikzpicture环境。主要问题似乎是legend keys的宽度没有被grid_plot正确捕获。
我提出了一个最小化的R代码来重现这个问题:
require(ggplot2)
require(grid)
require(gridExtra)
require(cowplot)
require(tikzDevice)

tikz(file = "./tmp.tex", width = 5.6, height = 2.2, standAlone = T )
mpg2 <- mpg

mpg2$cyl = as.factor(mpg2$cyl)
levels(mpg2$cyl) <- c("\\textbf{\\textsc{four}}",
                      "\\textbf{\\textsc{five}}",
                      "\\textbf{\\textsc{six}}",
                      "\\textbf{\\textsc{seven}}",
                      "\\textbf{\\textsc{eight}}")

plot.mpg <- ggplot(mpg2, aes(x=cty, colour=cyl, y = hwy)) + 
     geom_point() +
     theme(legend.position='none')

legend <- get_legend(plot.mpg + theme(legend.position = "top"))

print(plot_grid(legend, 
                 plot.mpg, nrow=2, ncol=1,align='h', 
                 rel_heights = c(.1, 1)))

dev.off()

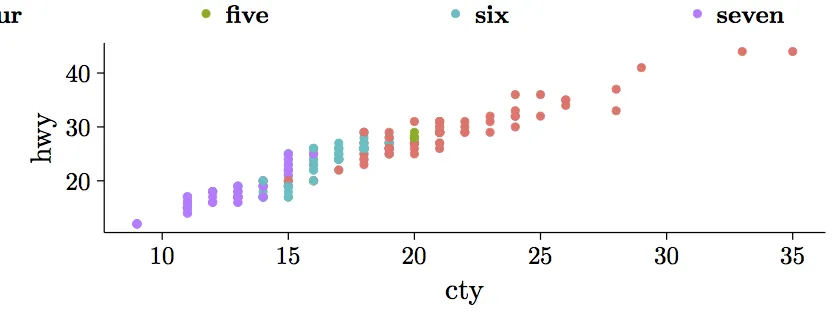
生成的PDF文件(在编译tmp.tex后)长这样:

enter image description here

我们可以看到,第一个图例键(四)只显示了部分,而图例键(八)完全不可见。我尝试更改tikz命令的宽度,但无济于事。
此外,我怀疑问题的原因是grid_plot命令错误地测量了如果传递LaTeX标记,则图例键的长度。为了证明这是问题的原因,请考虑将mpg2 $ cyl的级别更改如下:
levels(mpg2$cyl) <- c("four",
                      "five",
                      "six",
                      "seven",
                      "eight")

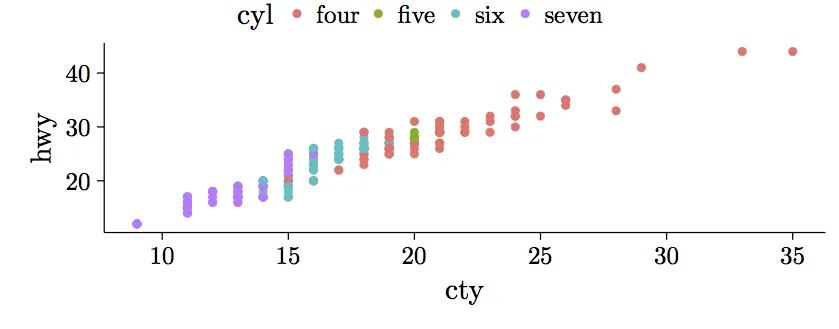
这应该会生成一个带有完美图例的下列绘图:

enter image description here

请注意,上面的示例仅用于重现问题,而不是我要做的事情。相反,我有四个图,我正在尝试为它们使用共享的公共图例。
请问有人可以告诉我如何解决包含Latex标记时的图例问题吗?
顺便说一下,这是我的 sessionInfo():
R version 3.3.2 (2016-10-31)
Platform: x86_64-apple-darwin13.4.0 (64-bit)
Running under: OS X Yosemite 10.10.5

locale:
[1] en_US.UTF-8/en_US.UTF-8/en_US.UTF-8/C/en_US.UTF-8/en_US.UTF-8

attached base packages:
[1] grid      stats     graphics  grDevices utils     datasets  methods  
[8] base     

other attached packages:
[1] tikzDevice_0.10-1 dplyr_0.5.0       gdata_2.17.0      cowplot_0.7.0    
[5] gridExtra_2.2.1   ggplot2_2.2.0    

loaded via a namespace (and not attached):
 [1] gtools_3.5.0       colorspace_1.2-6   DBI_0.5            RColorBrewer_1.1-2
 [5] plyr_1.8.4         munsell_0.4.3      gtable_0.2.0       labeling_0.3      
 [9] Rcpp_0.12.6        scales_0.4.1       filehash_2.3       digest_0.6.10     
[13] tools_3.3.2        magrittr_1.5       lazyeval_0.2.0     tibble_1.1        
[17] assertthat_0.1     R6_2.1.3         

谢谢大家。

2个回答

4

看起来ggplot2计算字符串宽度是基于原始字符串而不是TeX应返回的框大小。 我猜测这是在指南代码中过早进行的计算(即不是在绘图时)。 作为解决方法,您可以通过显式调用getLatexStrWidth在gtable中手动编辑相关宽度。 注意,我还在导言中添加了一个包,否则默认字体不显示粗体小型大写字母。

require(ggplot2)
require(grid)
require(gridExtra)
require(tikzDevice)

setTikzDefaults(overwrite = TRUE)
preamble <- options("tikzLatexPackages") 
options("tikzLatexPackages" = c(preamble$tikzLatexPackages, "\\usepackage{bold-extra}"))

tikz(file = "./tmp.tex", width = 5.6, height = 2.2, standAlone = TRUE )
mpg2 <- mpg

mpg2$cyl = as.factor(mpg2$cyl)

levels(mpg2$cyl) <- c("\\textbf{\\textsc{four}}",
                      "\\textbf{\\textsc{five}}",
                      "\\textbf{\\textsc{six}}",
                      "\\textbf{\\textsc{seven}}",
                      "\\textbf{\\textsc{eight}}")

p <- ggplot(mpg2, aes(x=cty, colour=cyl, y = hwy)) + 
  geom_point() +
  theme(legend.position='none')


leg <- cowplot::get_legend(p + theme(legend.position = "top"))

ids <- grep("label",leg$grobs[[1]]$layout$name)
pos <- leg$grobs[[1]]$layout$l[ids]
wl <- sapply(leg$grobs[[1]][["grobs"]][ids], function(g) getLatexStrWidth(g[["label"]]))

leg$grobs[[1]][["widths"]][pos] <- unit(wl, "pt")

grid.arrange(p, top=leg)

dev.off()

enter image description here


1
也许更容易引入一个临时标记,不会对字符串宽度产生太大影响,在 R 和 latex 步骤之间后处理 tex 文件。
levels(mpg2$cyl) <- c("$four$",
                      "$five$",
                      "$six$",
                      "$seven$",
                      "$eight$")

[...]

tmp <- readLines("tmp.tex")
gs <- gsub("\\$(four|five|six|seven|eight)\\$", "\\\\textsc{\\1}", tmp, perl=TRUE)
cat(paste(gs, collapse="\n"), file="tmp2.tex")

enter image description here


或者,您可以使用\four\five等字符串,并在Tex导言中定义它们(尽管反斜杠可能会令人痛苦)。 - baptiste
这个答案是一个“跳出思维定势”的例子。谢谢! - user8420488483439

网页内容由stack overflow 提供, 点击上面的
可以查看英文原文,
原文链接