在Python的Seaborn图中创建多列图例

4

我正在使用 seaborn.distplot (Python3)并希望为每个系列设置两个标签。

我尝试了一个巧妙的字符串格式化方法,如下所示:

# bigkey and bigcount are longest string lengths of my keys and counts
label = '{{:{}s}} - {{:{}d}}'.format(bigkey, bigcount).format(key, counts['sat'][key])

在文本宽度固定的控制台中,我得到了以下内容:
(-inf, 1)  -   2538
[1, 3)     -   7215
[3, 8)     -  40334
[8, 12)    -  20833
[12, 17)   -   6098
[17, 20)   -    499
[20, inf)  -     87

我假设图表中使用的字体不是等宽字体,因此我想知道是否有一种方法可以指定我的图例,使其具有2个对齐列的标签,并且可能使用`tuple`调用`seaborn.distplot`的`label`参数(或任何有效的方法)。
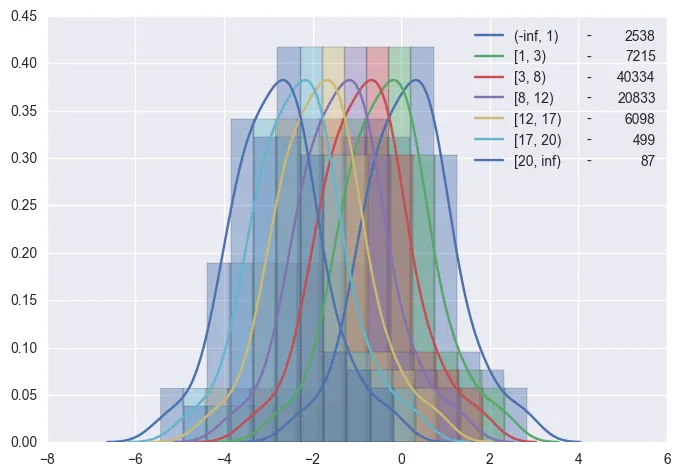
以下是参考图表: enter image description here 
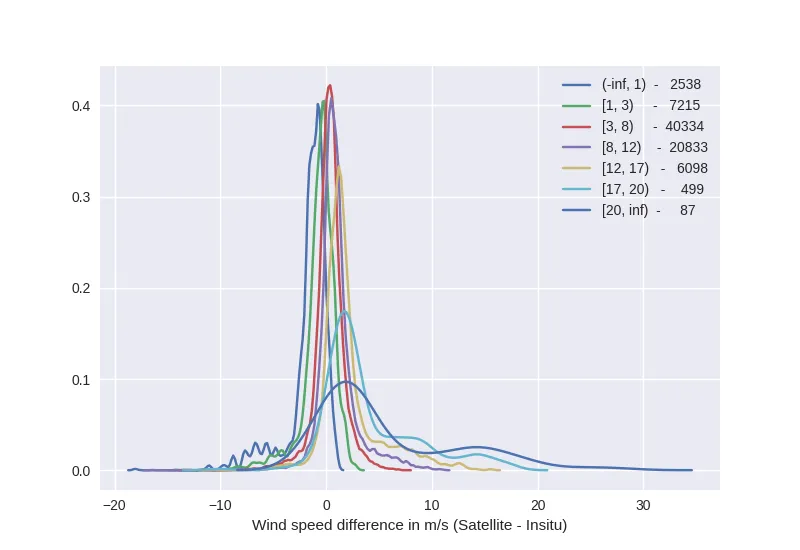
看起来不错,但我真的希望每个系列有2个标签能够对齐。

1
你可以为图例使用等宽字体吗? - mwaskom
1个回答

5

这并不是一种好的解决方案,但希望它是一个合理的解决方法。关键思想是将图例分为三列以达到对齐的目的,使第二列和第三列的图例不可见,并将第三列与其右侧对齐。

import io

import matplotlib
import matplotlib.pyplot as plt
import numpy as np
import seaborn as sns

x = np.random.randn(100)
s = [["(-inf, 1)", "-", 2538],
     ["[1, 3)", "-", 7215],
     ["[3, 8)", "-", 40334],
     ["[8, 12)", "-", 20833],
     ["[12, 17)", "-", 6098],
     ["[17, 20)", "-", 499],
     ["[20, inf)", "-", 87]]

fig, ax = plt.subplots()
for i in range(len(s)):
    sns.distplot(x - 0.5 * i, ax=ax)

empty = matplotlib.lines.Line2D([0],[0],visible=False)
leg_handles = ax.lines + [empty] * len(s) * 2
leg_labels = np.asarray(s).T.reshape(-1).tolist()
leg = plt.legend(handles=leg_handles, labels=leg_labels, ncol=3, columnspacing=-1)
plt.setp(leg.get_texts()[2 * len(s):], ha='right', position=(40, 0))

plt.show()

enter image description here


网页内容由stack overflow 提供, 点击上面的
可以查看英文原文,
原文链接