在 matplotlib 绘图中使用多种颜色

12

我有一个包含二维数据点(x,y)的numpy数组,这些数据点被分类为三类(0,1,2)。

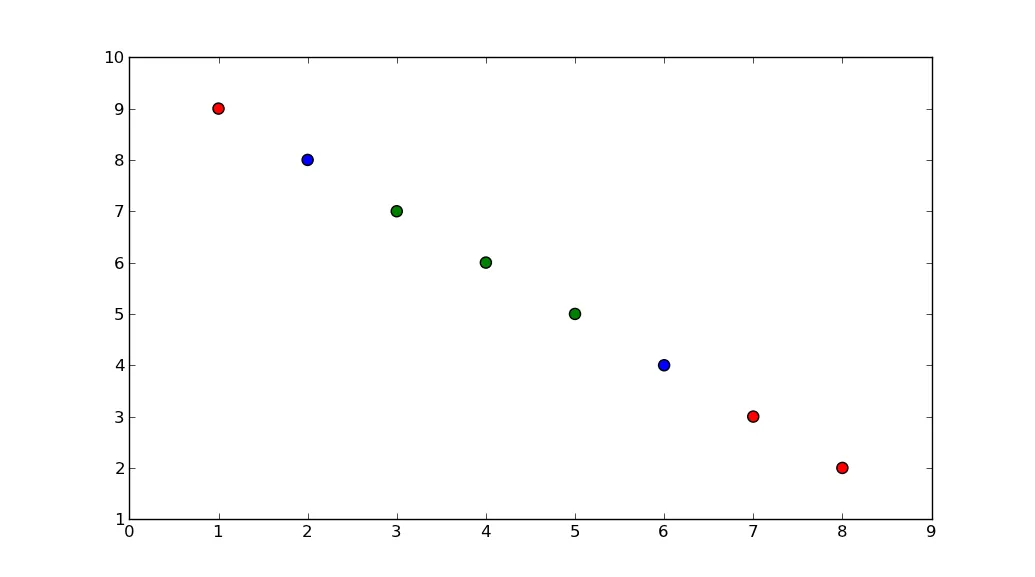
a = array([[ 1, 2, 3, 4, 5, 6, 7, 8 ],
           [ 9, 8, 7, 6, 5, 4, 3, 2 ]])

class = array([0, 2, 1, 1, 1, 2, 0, 0])

我想问一下,是否可以用多种颜色绘制这些点。我希望做出像这样的效果:

colors = list()
for i in class:
    if i == 0:
        colors.append('r')
    elif i == 1:
        colors.append('g')
    else:
        colors.append('b')

print colors
['r', 'b', 'g', 'g', 'g', 'b', 'r', 'r']

pp.plot(a[0], a[1], color = colors)
1个回答

15

我假设你想要绘制不同的数据点。如果是这样的话,你可以定义一个numpy数组:

colormap = np.array(['r', 'g', 'b'])

然后,您可以使用colormap[categories]生成颜色数组:

In [18]: colormap[categories]
Out[18]: 
array(['r', 'b', 'g', 'g', 'g', 'b', 'r', 'r'], 
      dtype='|S1')

import matplotlib.pyplot as plt
import numpy as np

a = np.array([[ 1, 2, 3, 4, 5, 6, 7, 8 ],
              [ 9, 8, 7, 6, 5, 4, 3, 2 ]])

categories = np.array([0, 2, 1, 1, 1, 2, 0, 0])

colormap = np.array(['r', 'g', 'b'])

plt.scatter(a[0], a[1], s=50, c=colormap[categories])
plt.show()

收益率 enter image description here

网页内容由stack overflow 提供, 点击上面的
可以查看英文原文,
原文链接