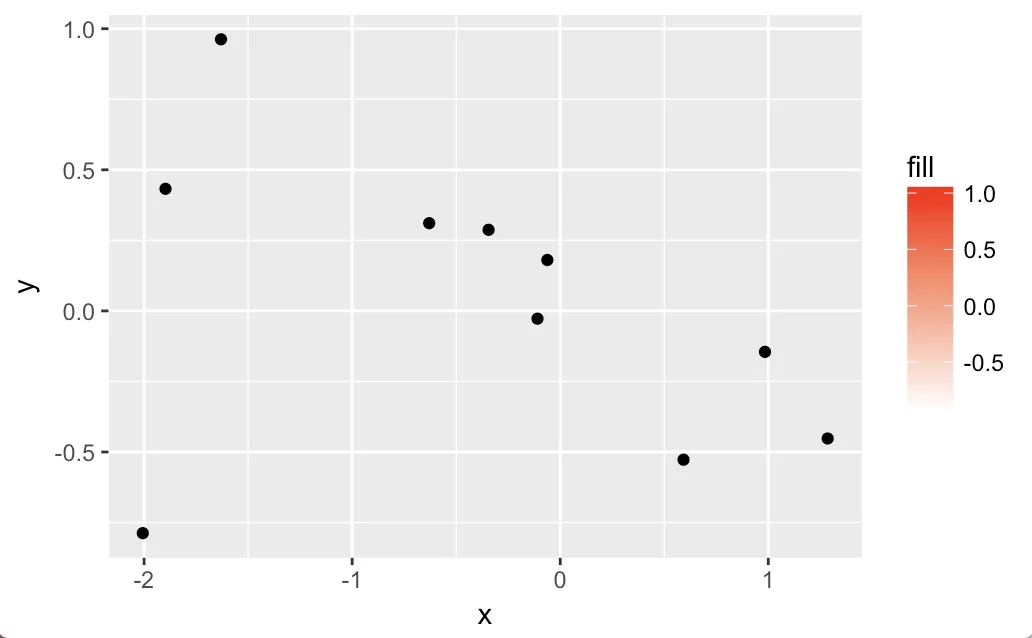
我在ggplot图中有一个颜色条,从白色到红色,但是在白色背景上,白色边框不太容易看清。
是否有办法将图例中的刻度标记颜色改变或在渐变尺度周围添加边框?
这是一个最简示例:
df <- data.frame(x <- rnorm(10),
                 y <- rnorm(10),
                 fill <- rnorm(10))

ggplot(df, aes(x, y, fill = fill)) +
  geom_point() +
  scale_fill_gradient(low = 'white', high = 'red')
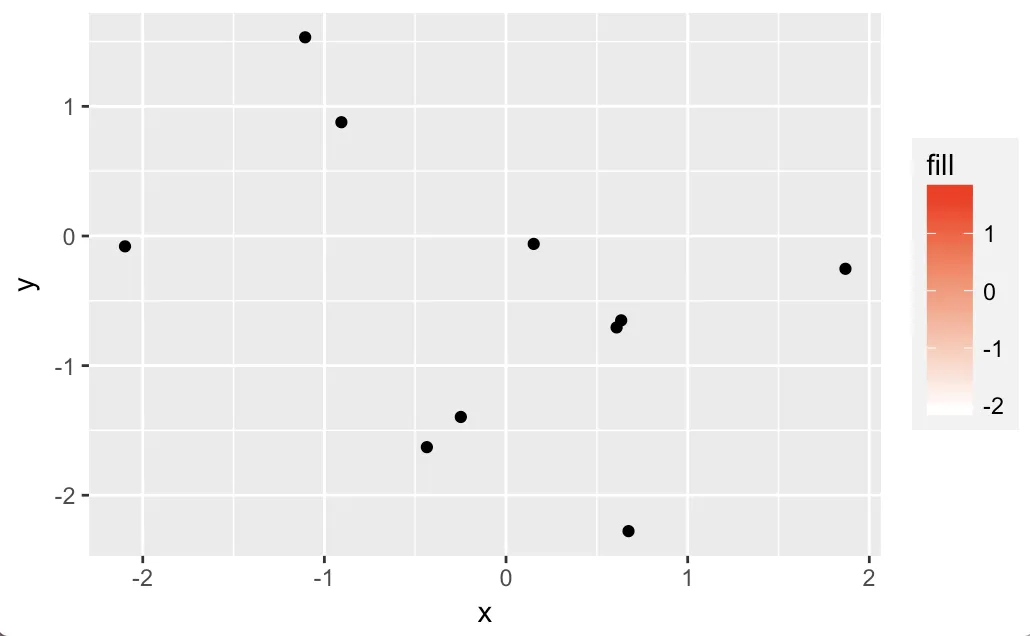
+ theme(legend.background = element_rect(fill = "light grey"))的内容。 - Roland