我正在使用ggplot2从多个数据帧绘制数据,具体做法如下:
# subset of iris data
vdf = iris[which(iris$Species == "virginica"),]
# plot from iris and from vdf
ggplot(iris) +
   geom_line(aes(x=Sepal.Width, y=Sepal.Length, colour=Species)) +
   geom_line(aes(x=Sepal.Width, y=Sepal.Length), colour="gray", size=2,
             data=vdf)
colour的图例只包括来自iris的条目,而不包括来自vdf的条目。我该如何让ggplot2从data=vdf中添加一个图例,在这种情况下将显示一条灰色线条,位于iris的图例下方?谢谢。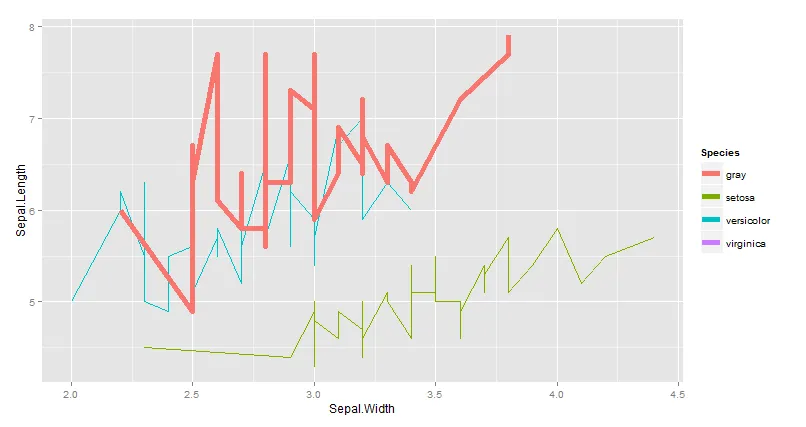
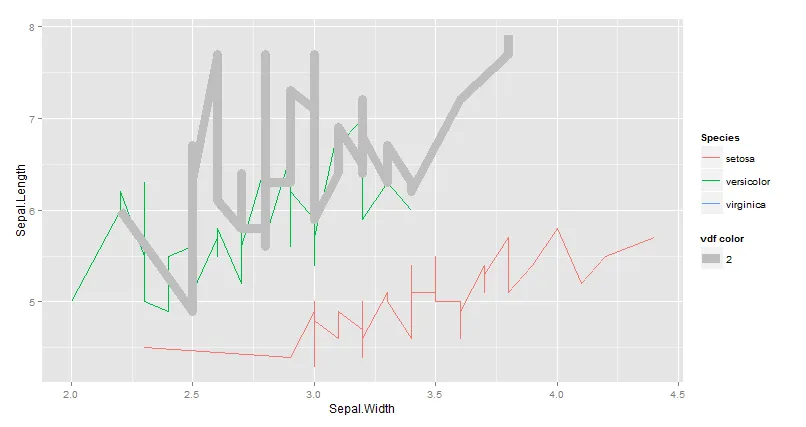

ggnewscale,它可以让你为颜色/填充添加一个新的比例尺槽位。点击此处获取更多信息:https://eliocamp.github.io/ggnewscale/。 - RobertoSupe