library(ggplot2)
library(cumplyr)
library(scales)
library(RColorBrewer)
myPalette <- colorRampPalette(rev(brewer.pal(11, "Spectral")))
x = 1:5
y = 1:5
pts = cartesian_product(c('x','y'))
d1 = cbind(pts, runif(nrow(pts),min=0,max=1), 1)
d2 = cbind(pts, runif(nrow(pts),min=0,max=4), 2)
colnames(d1) = colnames(d2) = c("x","y","val","k")
d = rbind(d1,d2)
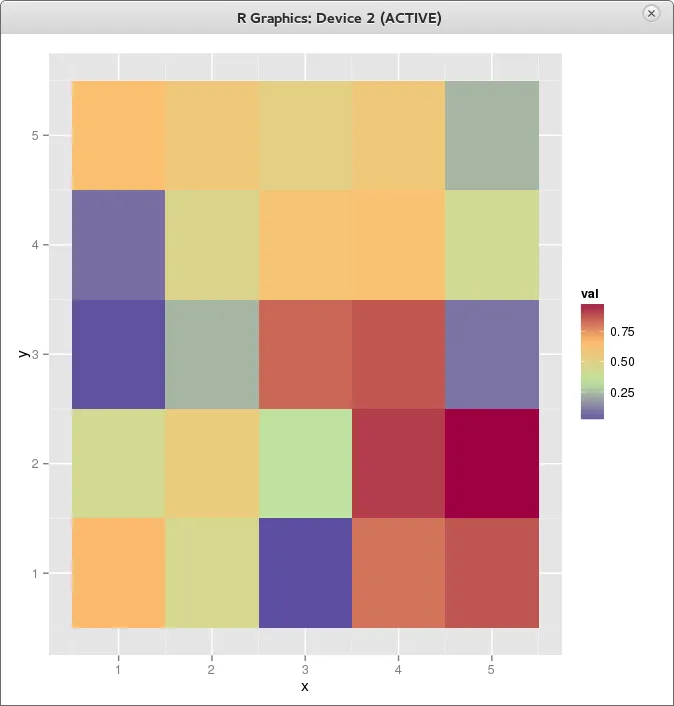
p1 <- ggplot(d1)
p1 <- p1 + geom_tile(aes(x = x, y = y, fill = val))
p1 <- p1 + scale_fill_gradientn(colours = myPalette(4))
p1
p2 <- ggplot(d2, aes(x = x, y = y, fill = val))
p2 <- p2 + geom_tile(aes(x = x, y = y, fill = val))
p2 <- p2 + scale_fill_gradientn(colours = myPalette(4))
p2
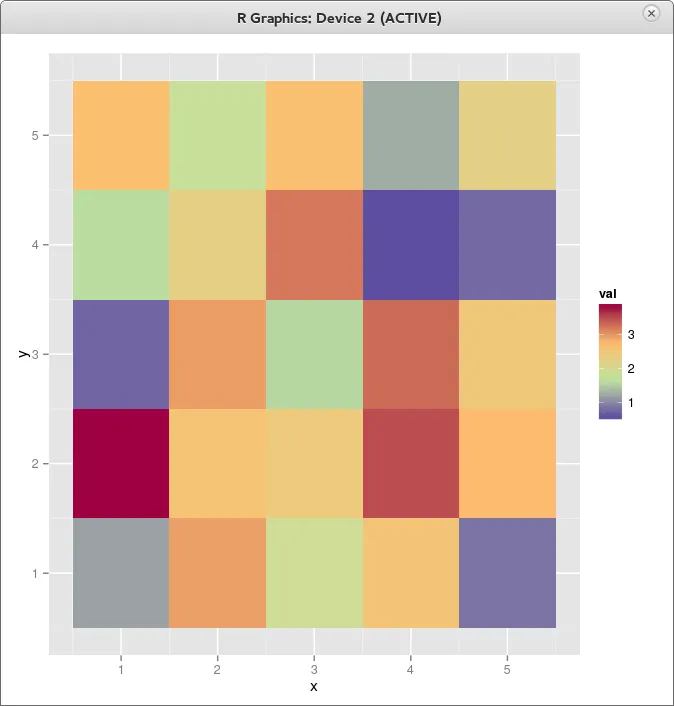
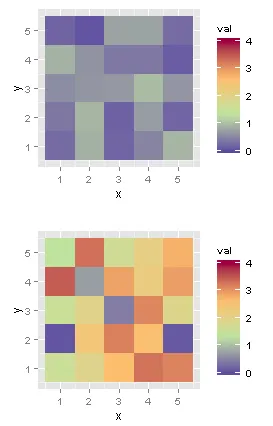
这导致了下面的两个图。我的问题是,使用相同类型的颜色方案,如何使两个图使用相同的值刻度?例如,p1应该比p2更加均匀。
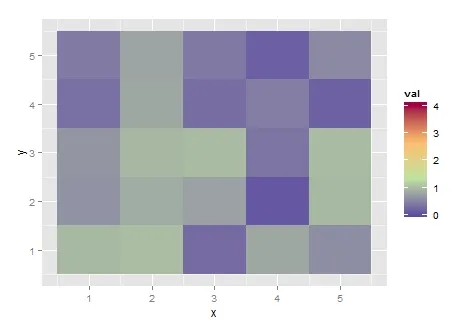
p1:
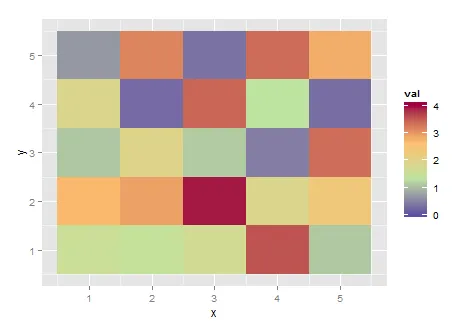
p2: