在ggplot2中重新着色图例文本背景

4

使用这段代码:

ggplot(mtcars, aes(x=mtcars$mpg, y = mtcars$wt, color = as.factor(mtcars$cyl))) + geom_point()

我得到了一个不错的图形,如下所示:

enter image description here

为了我的目的,我希望图例看起来像这样:

enter image description here

简而言之,我想要颜色图例的背景与标签的对应颜色相匹配。有没有简单的方法来实现这个功能?
编辑:在我的当前代码中,我正在使用ggtextscale_color_hue(labels = colorLabels),其中colorLabels看起来像这样<span style='color:red'>MyLabel</span>以使文本本身呈现不同的颜色,但我并不是很喜欢它,我想看看更换颜色后的感觉。将color:red替换为background-color:red只会删除文本颜色,而不会实际上色。
1个回答

1
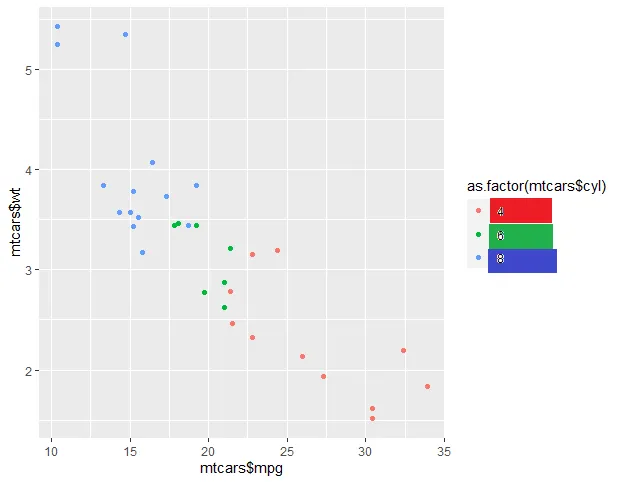
这里有一个"dirty hack",因为ggplot没有提供更改标签背景的API。
免责声明:此方法假定底层的grobs具有某种结构,可能无法保证。因此,请小心使用。
library(ggplot2)
library(grid)
library(gtable)


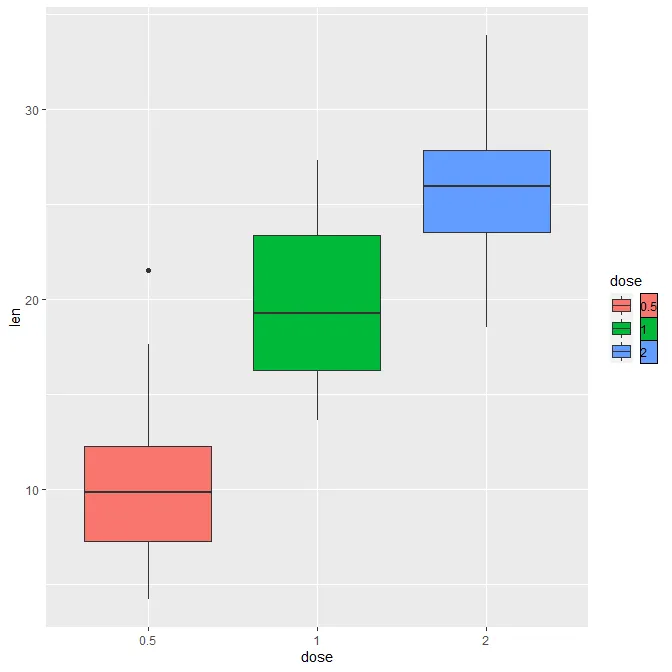
ToothGrowth$dose <- as.factor(ToothGrowth$dose)

p <- ggplot(ToothGrowth, aes(x=dose, y=len, fill=dose)) + 
  geom_boxplot()

## 1. Store ggplot object as grob
g <- ggplotGrob(p)

## 2. Find and retrieve the guidebox and guides
guide <- g$grobs[[which(g$layout$name == "guide-box")]]
guides <- guide$grobs[[which(guide$layout$name == "guides")]]

## 3. Get the fill colors of the guide
## N.B. This works in this toy example because the key has a fill property, 
## this may be different for other geoms
cols <- vapply(guides$grobs[grep("^key.+[^b][^g]$", guides$layout$name)],
               function(gt) gt$gp$fill, character(1))

## 4. Get the positions of the labels
pos <- guides$layout[grep("^label", guides$layout$name), 
                     c("t", "l", "b", "r", "z")]

## 5. Add colored rects below the labels
## N.B. These span the width of labels
## some more work would be needed to make them bigger and/or center the labels
for (i in seq_along(cols)) {
  guides <- gtable_add_grob(guides,
                            rectGrob(gp = gpar(fill = cols[i])),
                            pos[i, "t"],
                            pos[i, "l"],
                            pos[i, "b"],
                            pos[i, "r"],
                            pos[i, "z"] - 1,
                            name = paste0("key-bg-", i))
}

## 6. Write back the guides to the original object
guide$grobs[[which(guide$layout$name == "guides")]] <- guides
g$grobs[[which(g$layout$name == "guide-box")]] <- guide

## 7. Draw the graph
grid.draw(g)

Colored Keys


我已经接受了这个答案,但是如果有一天我不在了,我希望我的同事们也能理解它哈哈。谢谢! - Jeff

网页内容由stack overflow 提供, 点击上面的
可以查看英文原文,
原文链接