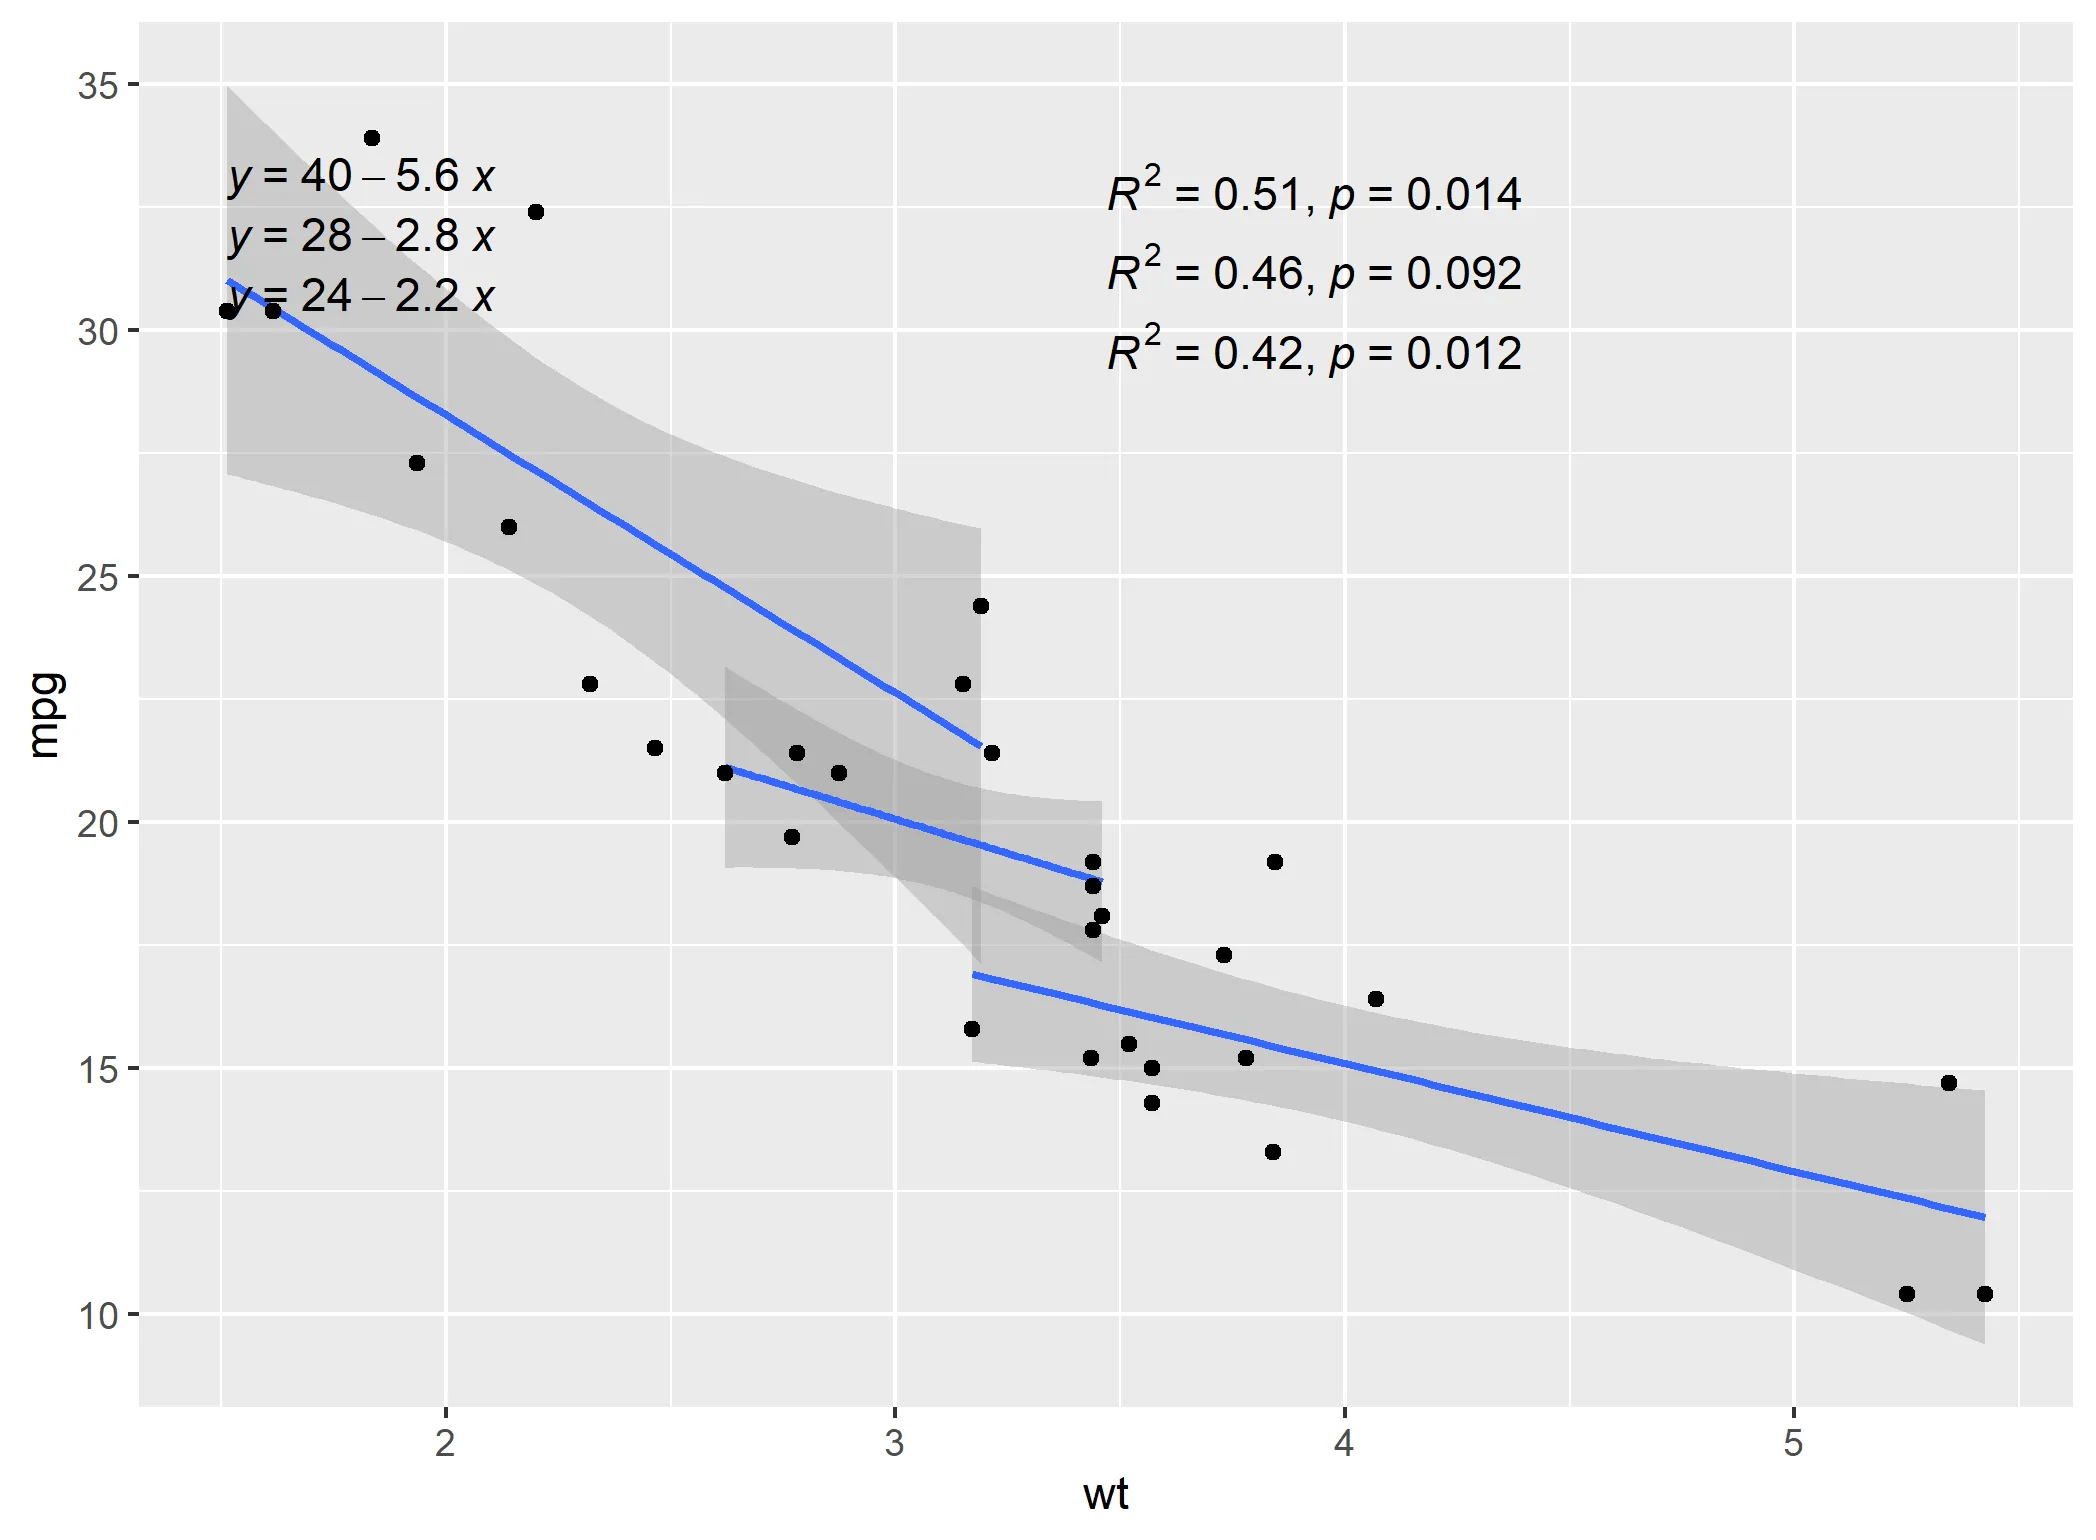
如何在 ggplot 图表中整洁地添加回归方程、R2 值和 p 值(针对回归方程)?最好与分组和 facet 兼容。这个第一个图中使用 ggpubr 按组添加了回归方程和 r2 值以及 p 值,但它们没有对齐吗?我有什么遗漏吗?能否将它们作为一个字符串包含在其中?
library(ggplot)
library(ggpubr)

ggplot(mtcars, aes(x = wt, y = mpg, group = cyl))+
  geom_smooth(method="lm")+
  geom_point()+
  stat_regline_equation()+
  stat_cor(aes(label = paste(..rr.label.., ..p.label.., sep = "*`,`~")),
           label.x.npc = "centre")
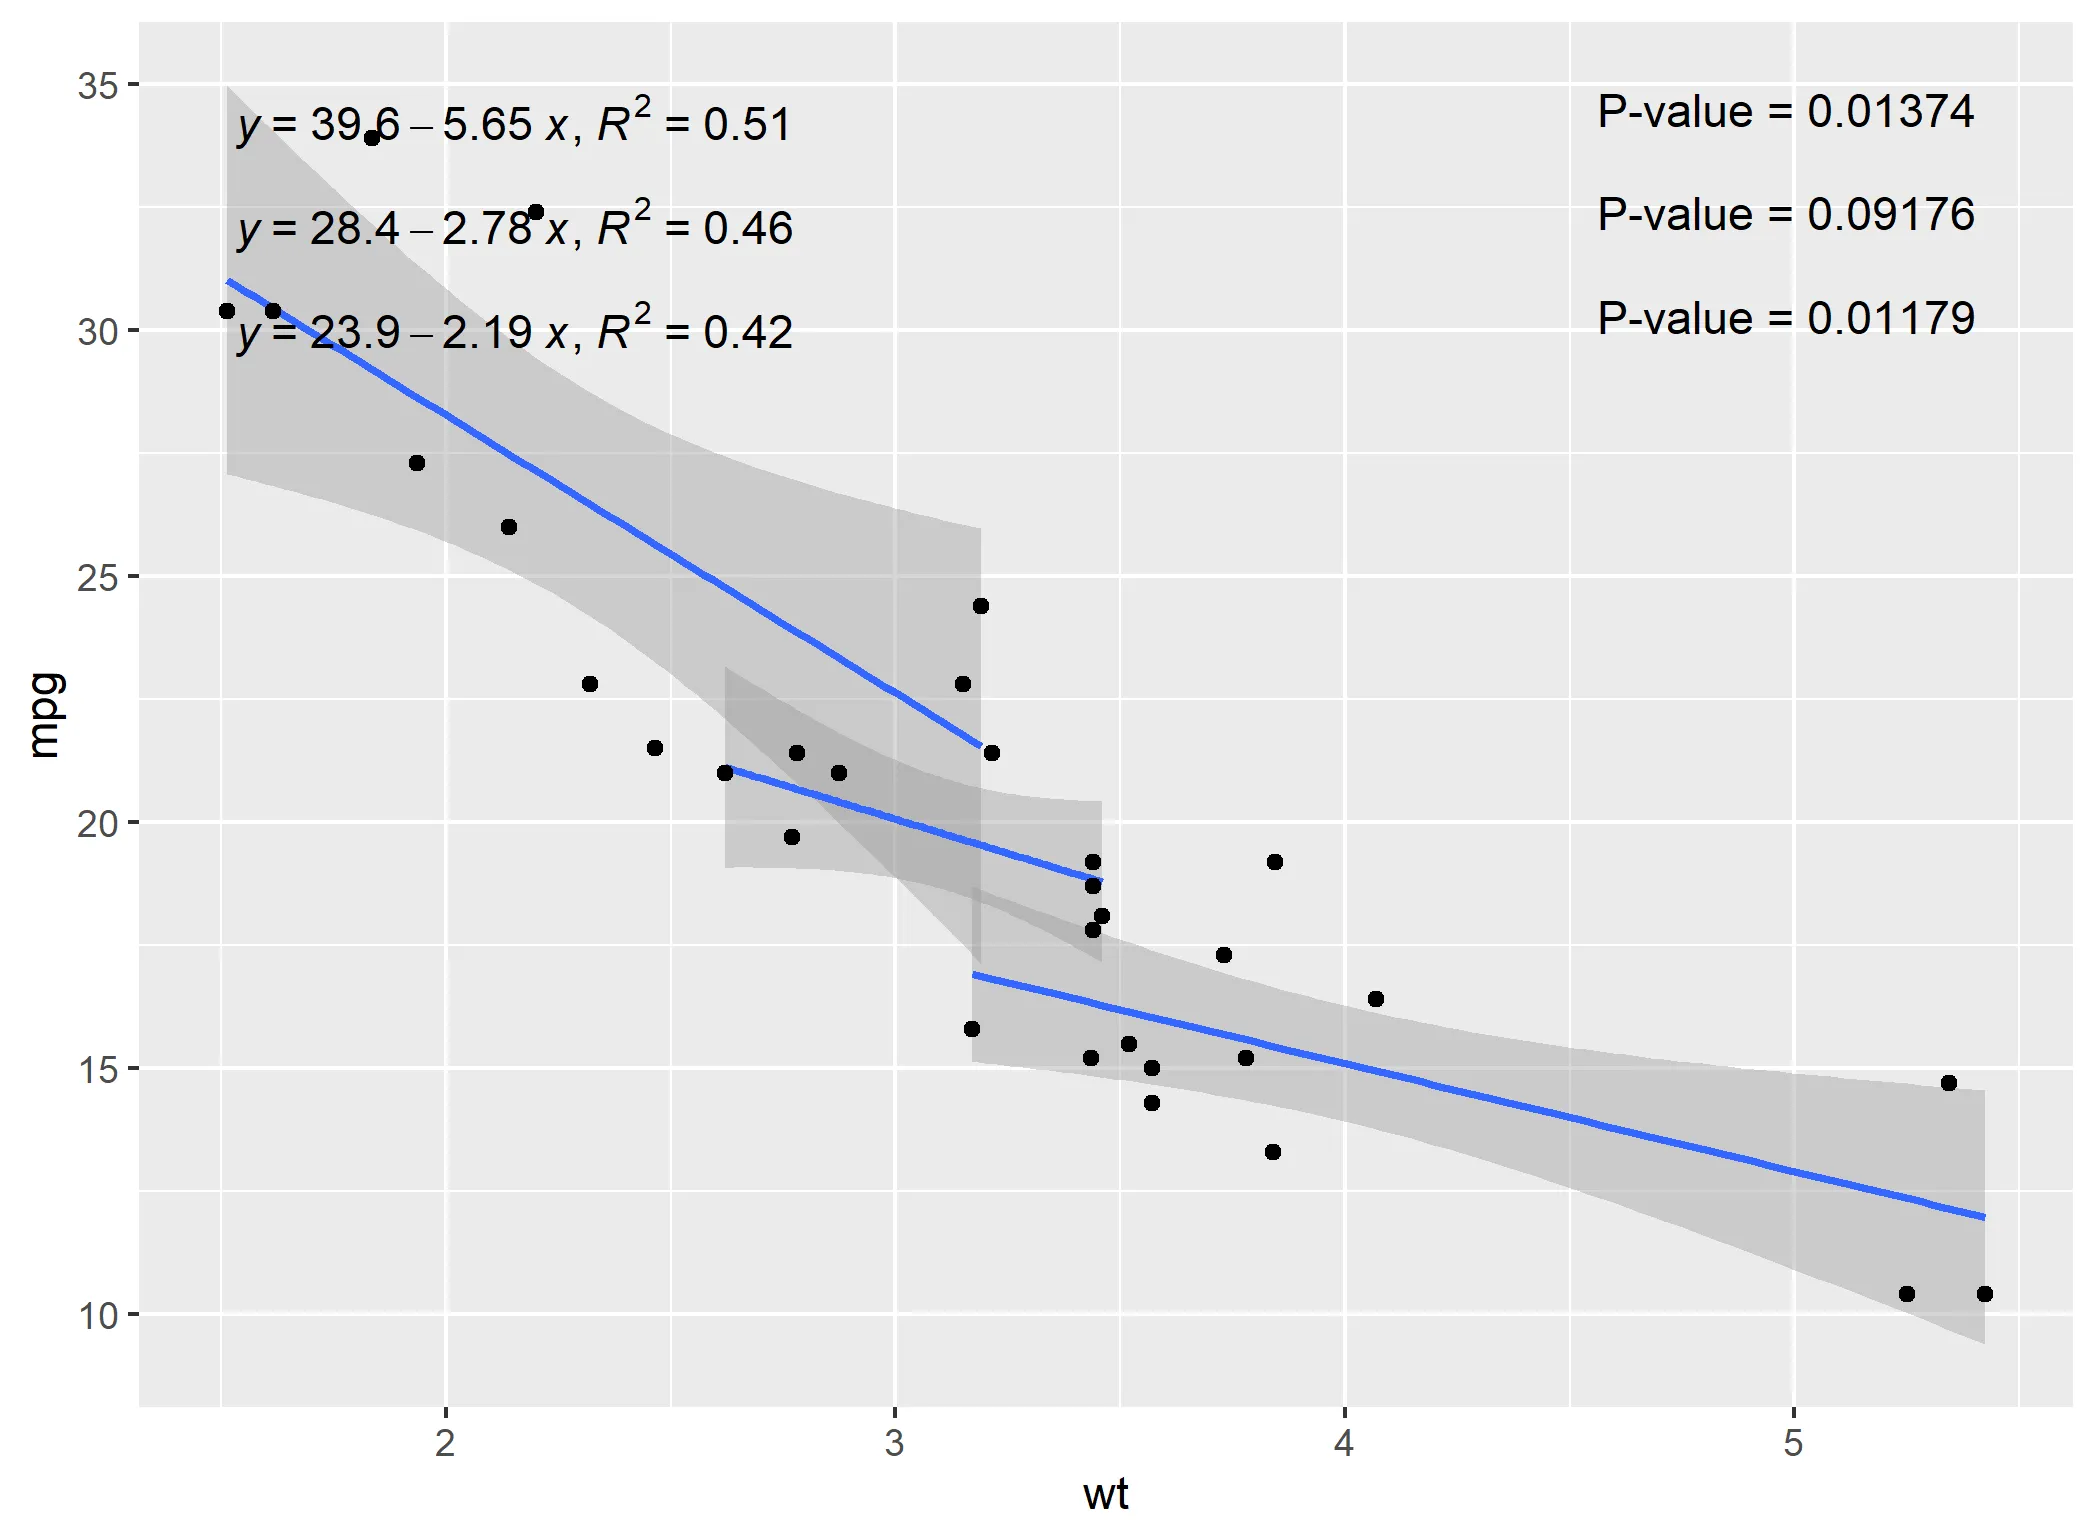
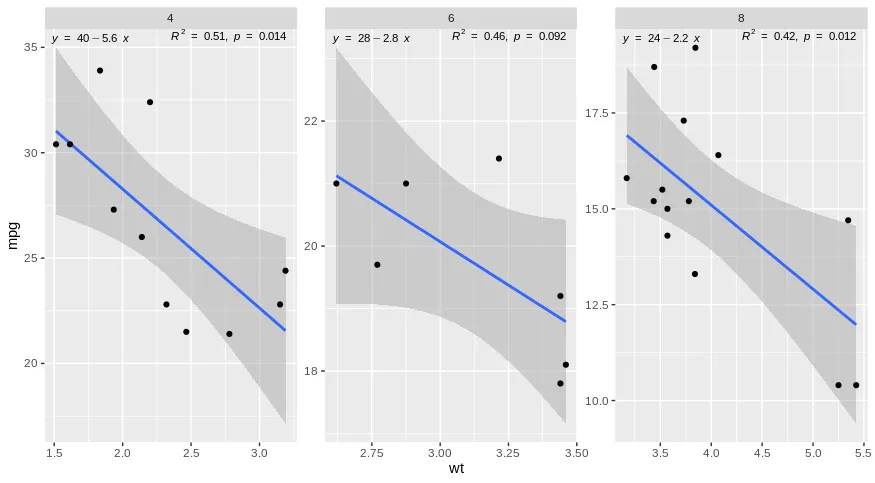
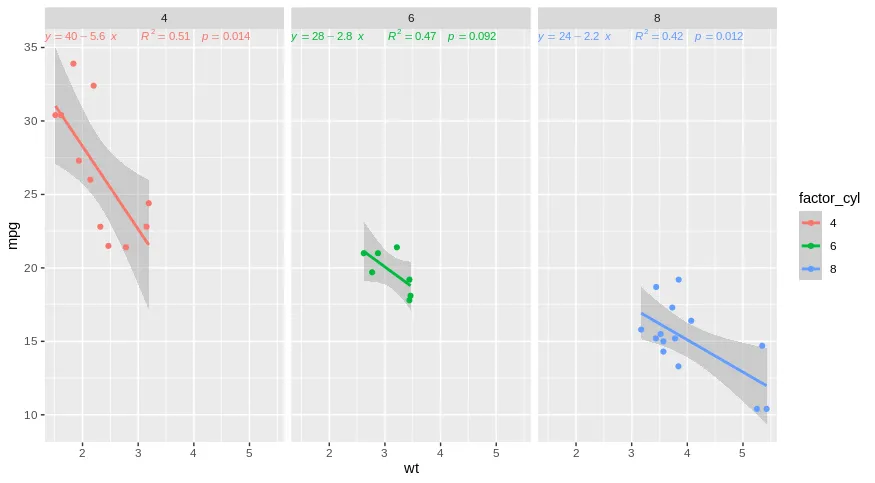
这里有一个使用ggpmisc的选项,可以实现一些奇怪的放置。
编辑 奇怪的放置是由于geom=text引起的,我已将其注释掉以提供更好的放置,并添加了`label.x="right"`来停止重叠。我们仍然存在与ggpubr不对齐的问题,这是由@dc37标记的上标问题造成的。
#https://dev59.com/xFoU5IYBdhLWcg3wYWEM#37708832
library(ggpmisc)

ggplot(mtcars, aes(x = wt, y = mpg, group = cyl))+
  geom_smooth(method="lm")+
  geom_point()+
  stat_poly_eq(formula = "y~x",
             aes(label = paste(..eq.label.., ..rr.label.., sep = "*`,`~")),
             parse = TRUE)+
  stat_fit_glance(method = 'lm',
                  method.args = list(formula = "y~x"),
                  #geom = 'text',

                  aes(label = paste("P-value = ", signif(..p.value.., digits = 4), sep = "")))
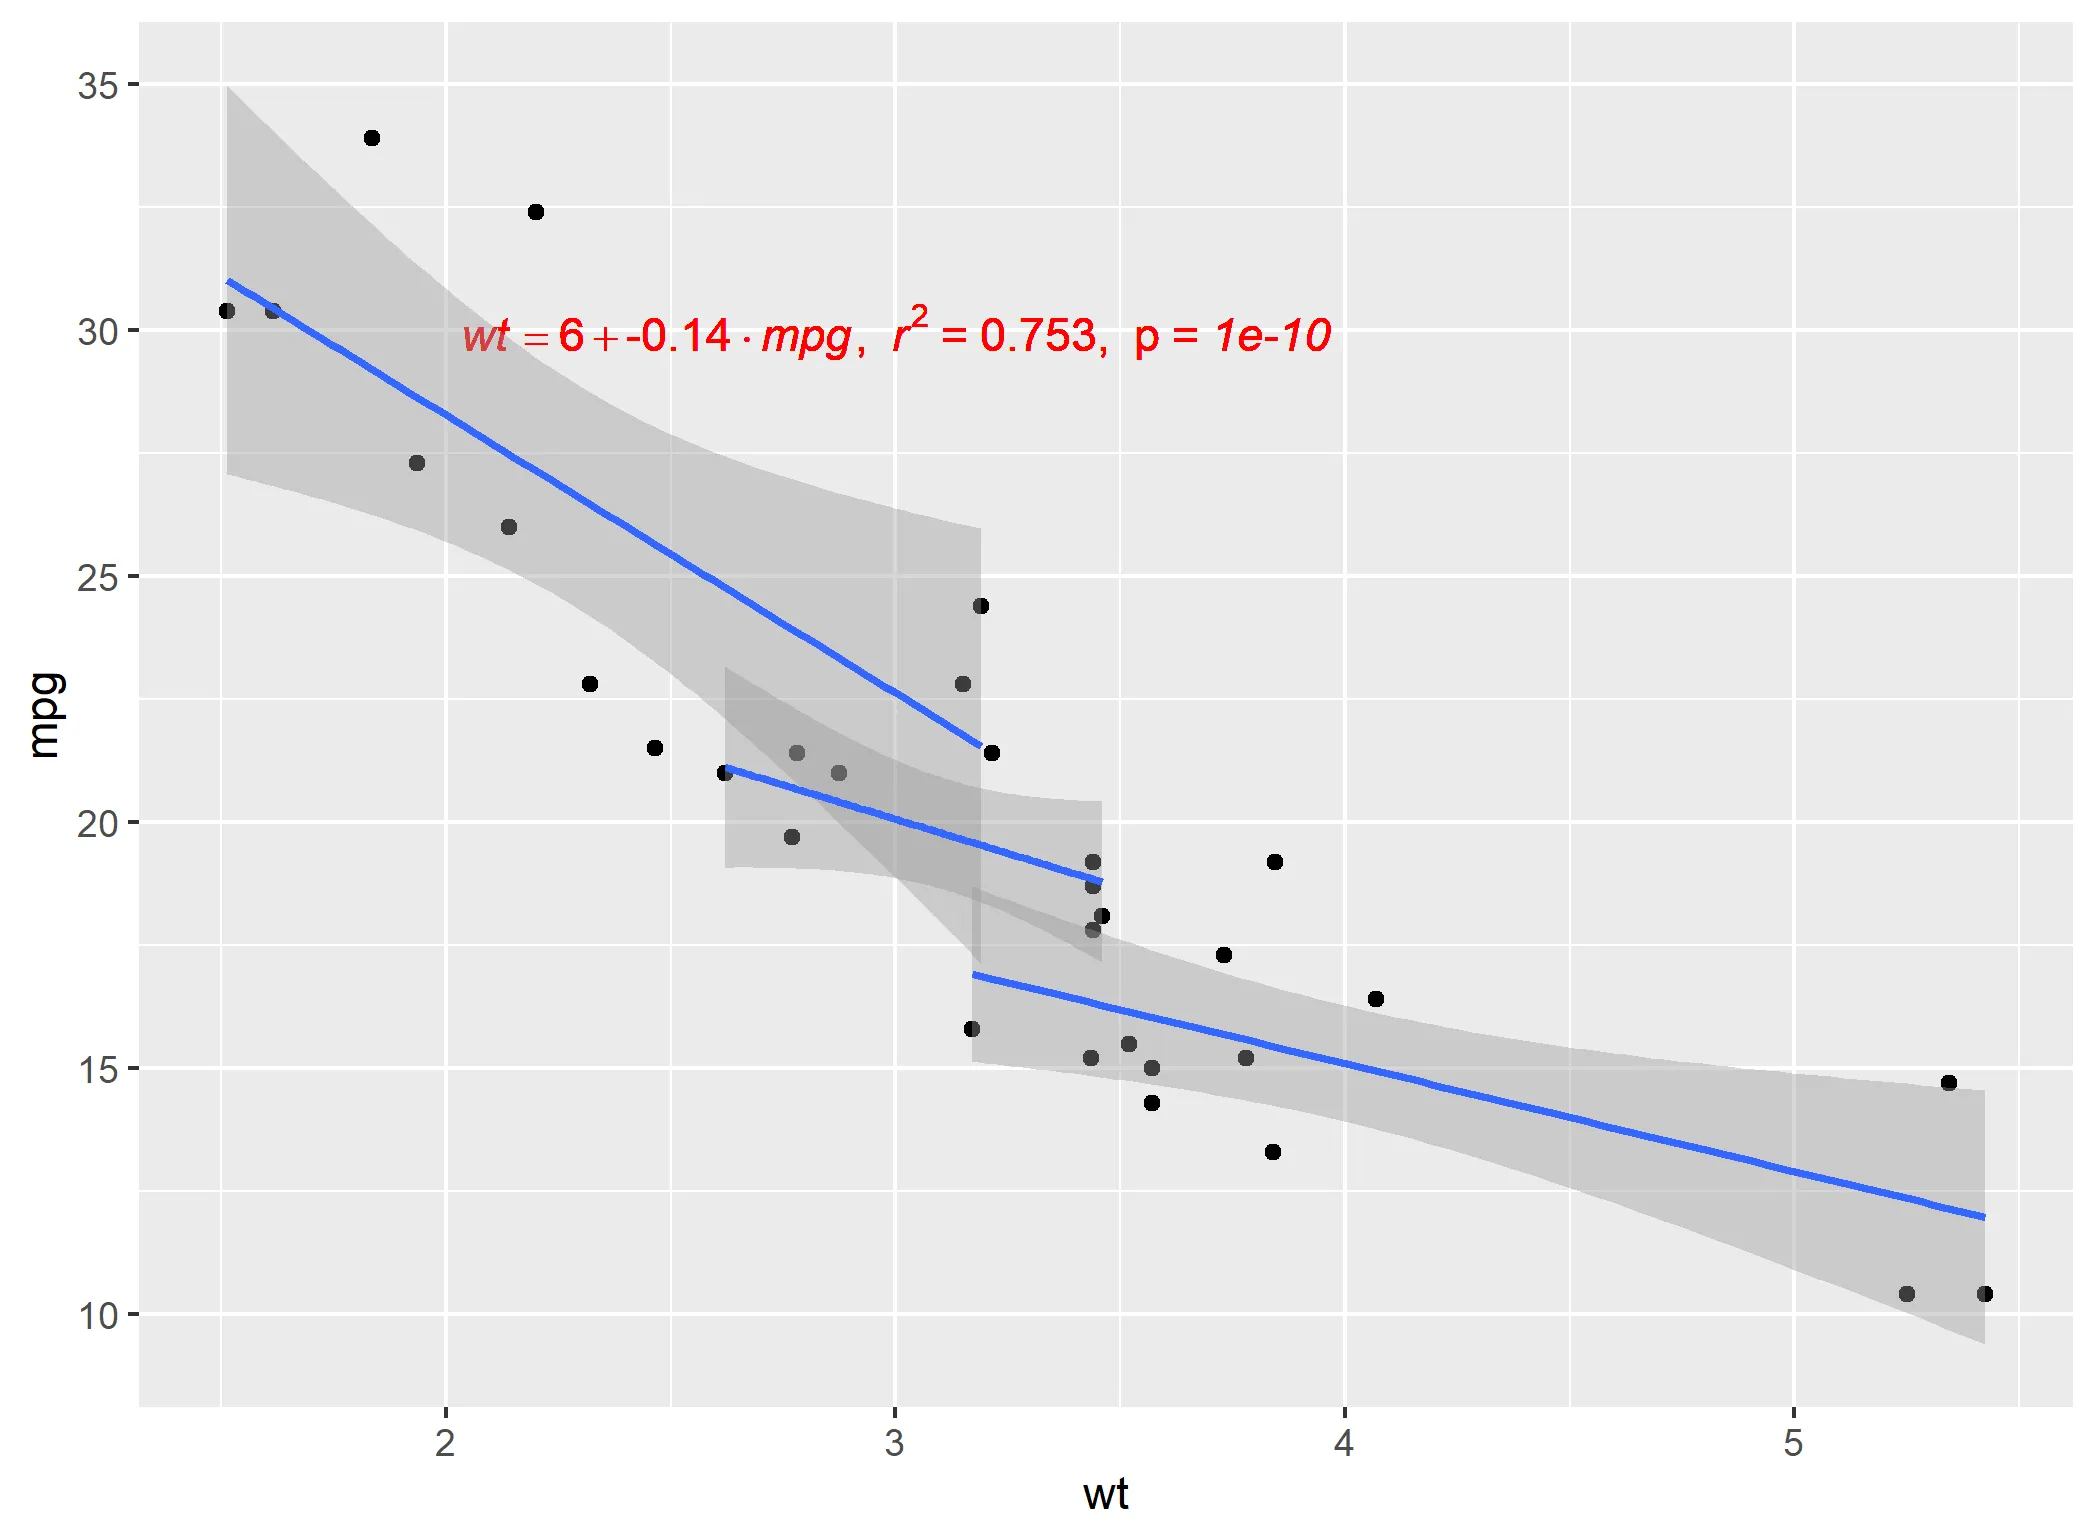
我已经找到了一个将相关统计信息汇总的好方法,但这需要在ggplot之外创建回归,并进行一堆字符串操作-这是最简单的方法吗?此外,它目前的编码不涉及分组,并且无法处理面板。
#https://dev59.com/vmsz5IYBdhLWcg3w9soQ#51974753
#Solution as one string, equation, R2 and p-value
lm_eqn <- function(df, y, x){
  formula = as.formula(sprintf('%s ~ %s', y, x))
  m <- lm(formula, data=df);
  # formating the values into a summary string to print out
  # ~ give some space, but equal size and comma need to be quoted
  eq <- substitute(italic(target) == a + b %.% italic(input)*","~~italic(r)^2~"="~r2*","~~p~"="~italic(pvalue),
                   list(target = y,
                        input = x,
                        a = format(as.vector(coef(m)[1]), digits = 2),
                        b = format(as.vector(coef(m)[2]), digits = 2),
                        r2 = format(summary(m)$r.squared, digits = 3),
                        # getting the pvalue is painful
                        pvalue = format(summary(m)$coefficients[2,'Pr(>|t|)'], digits=1)
                   )
  )
  as.character(as.expression(eq));
}

ggplot(mtcars, aes(x = wt, y = mpg, group=cyl))+
  geom_point() +
  geom_text(x=3,y=30,label=lm_eqn(mtcars, 'wt','mpg'),color='red',parse=T) +
  geom_smooth(method='lm')
stat_poly_eq(...)中使用sep = "~~~"。 - monarque13