我希望安排3个正方形的ggplot图,其中一个较大,另外两个较小,与第一个图并排显示。
以下是我的尝试:
以下是我的尝试:
gg1 <- ggplot(mtcars,aes(x=hp,y=mpg))+
        geom_point(aes(color=factor(cyl)),alpha=.5)+
        stat_smooth(method='lm', se=F, color='red')+
        ggtitle('plot 1')+
        theme_bw()+
        theme(aspect.ratio=1,
              legend.position = c(1, 1),
              legend.justification = c(1,1),
              legend.background = element_rect(colour = NA, fill = NA))


gg2 <- ggplot(mtcars)+
        geom_density(aes(x=hp, color=factor(cyl)))+
        ggtitle('plot 2')+
        theme_bw()+
        theme(aspect.ratio=1,
              legend.position = c(1, 1),
              legend.justification = c(1,1),
              legend.background = element_rect(colour = NA, fill = NA))


gg3 <- ggplot(mtcars)+
        geom_density(aes(x=mpg, color=factor(cyl)))+
        ggtitle('plot 3')+
        theme_bw()+
        theme(aspect.ratio=1,
              legend.position = c(1, 1),
              legend.justification = c(1,1),
              legend.background = element_rect(colour = NA, fill = NA))

grid.arrange(arrangeGrob(gg1),
             arrangeGrob(gg2,gg3, ncol=1),
             ncol=2, widths=c(1,1))
基本上,我希望小图2的顶部边框与大图1的顶部边框水平对齐,同时将plot3的底部边框与plot1的底部边框水平对齐。此外,ggtitle1应该与ggtitle2水平对齐。
当我保存我的三合一图时(即使保持所需的宽高比),
png(file = 'test.png',width=900,height=600)
grid.arrange(arrangeGrob(gg1),
             arrangeGrob(gg2,gg3, ncol=1),
             ncol=2, widths=c(1,1))
dev.off()
我得到了这样的东西
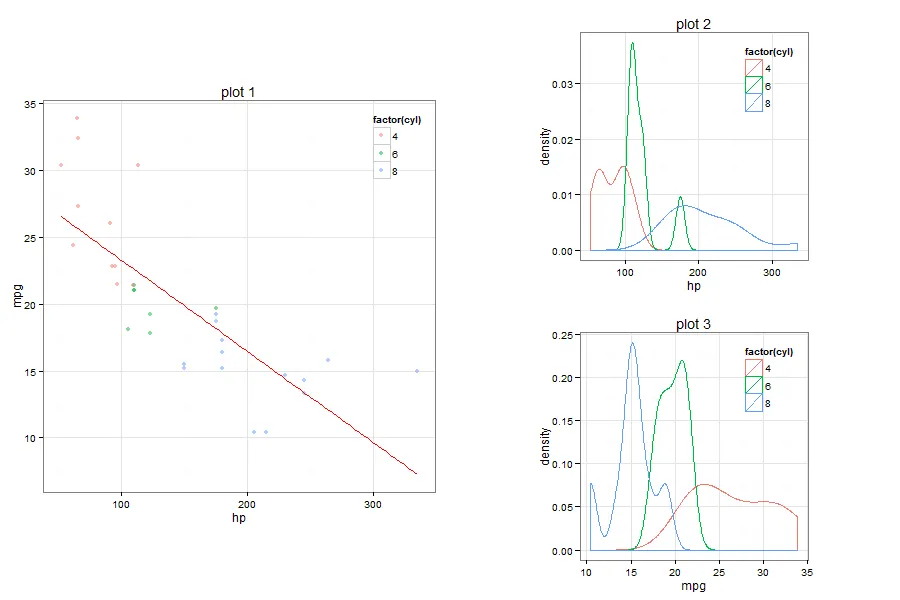
有什么想法来管理整齐的安排吗?
widths=c(2,1)可以解决它 :-) - drmariod