使用
我得到了这个情节。
df 和以下代码library(dplyr)
library(ggplot2)
library(devtools)
df <- diamonds %>%
dplyr::filter(cut%in%c("Fair","Ideal")) %>%
dplyr::filter(clarity%in%c("I1" , "SI2" , "SI1" , "VS2" , "VS1", "VVS2")) %>%
dplyr::mutate(new_price = ifelse(cut == "Fair",
price* 0.5,
price * 1.1))
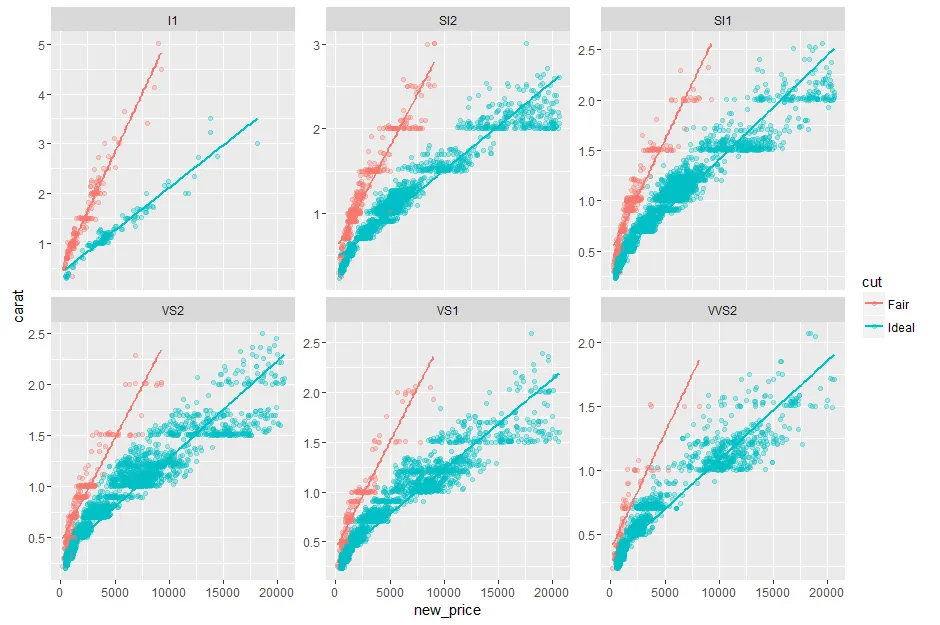
ggplot(df, aes(x= new_price, y= carat, color = cut))+
geom_point(alpha = 0.3)+
facet_wrap(~clarity, scales = "free_y")+
geom_smooth(method = "lm", se = F)
我得到了这个情节。
source_gist("524eade46135f6348140")
ggplot(df, aes(x= new_price, y= carat, color = cut))+
  stat_smooth_func(geom="text",method="lm",hjust=0,parse=TRUE)+
  geom_point(alpha = 0.3)+
  facet_wrap(~clarity, scales = "free_y")+
  geom_smooth(method = "lm", se = F)
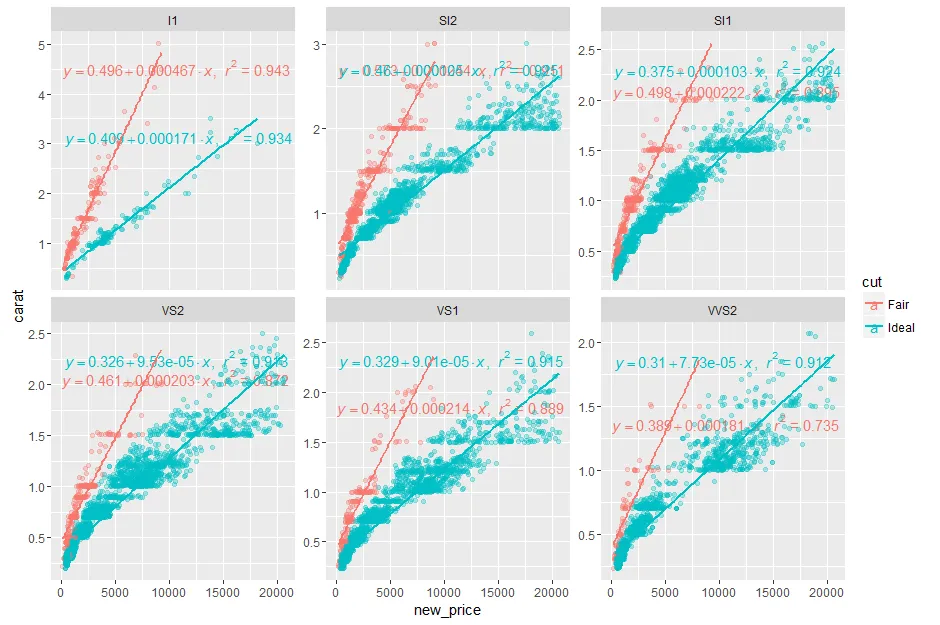
vjust和hjust来调整位置,但没有成功。非常感谢您提供任何建议。
ggpmisc包的作者在ggplot2:添加回归线方程和R2图的答案以获取更多详细信息或联系作者。 - Uwe