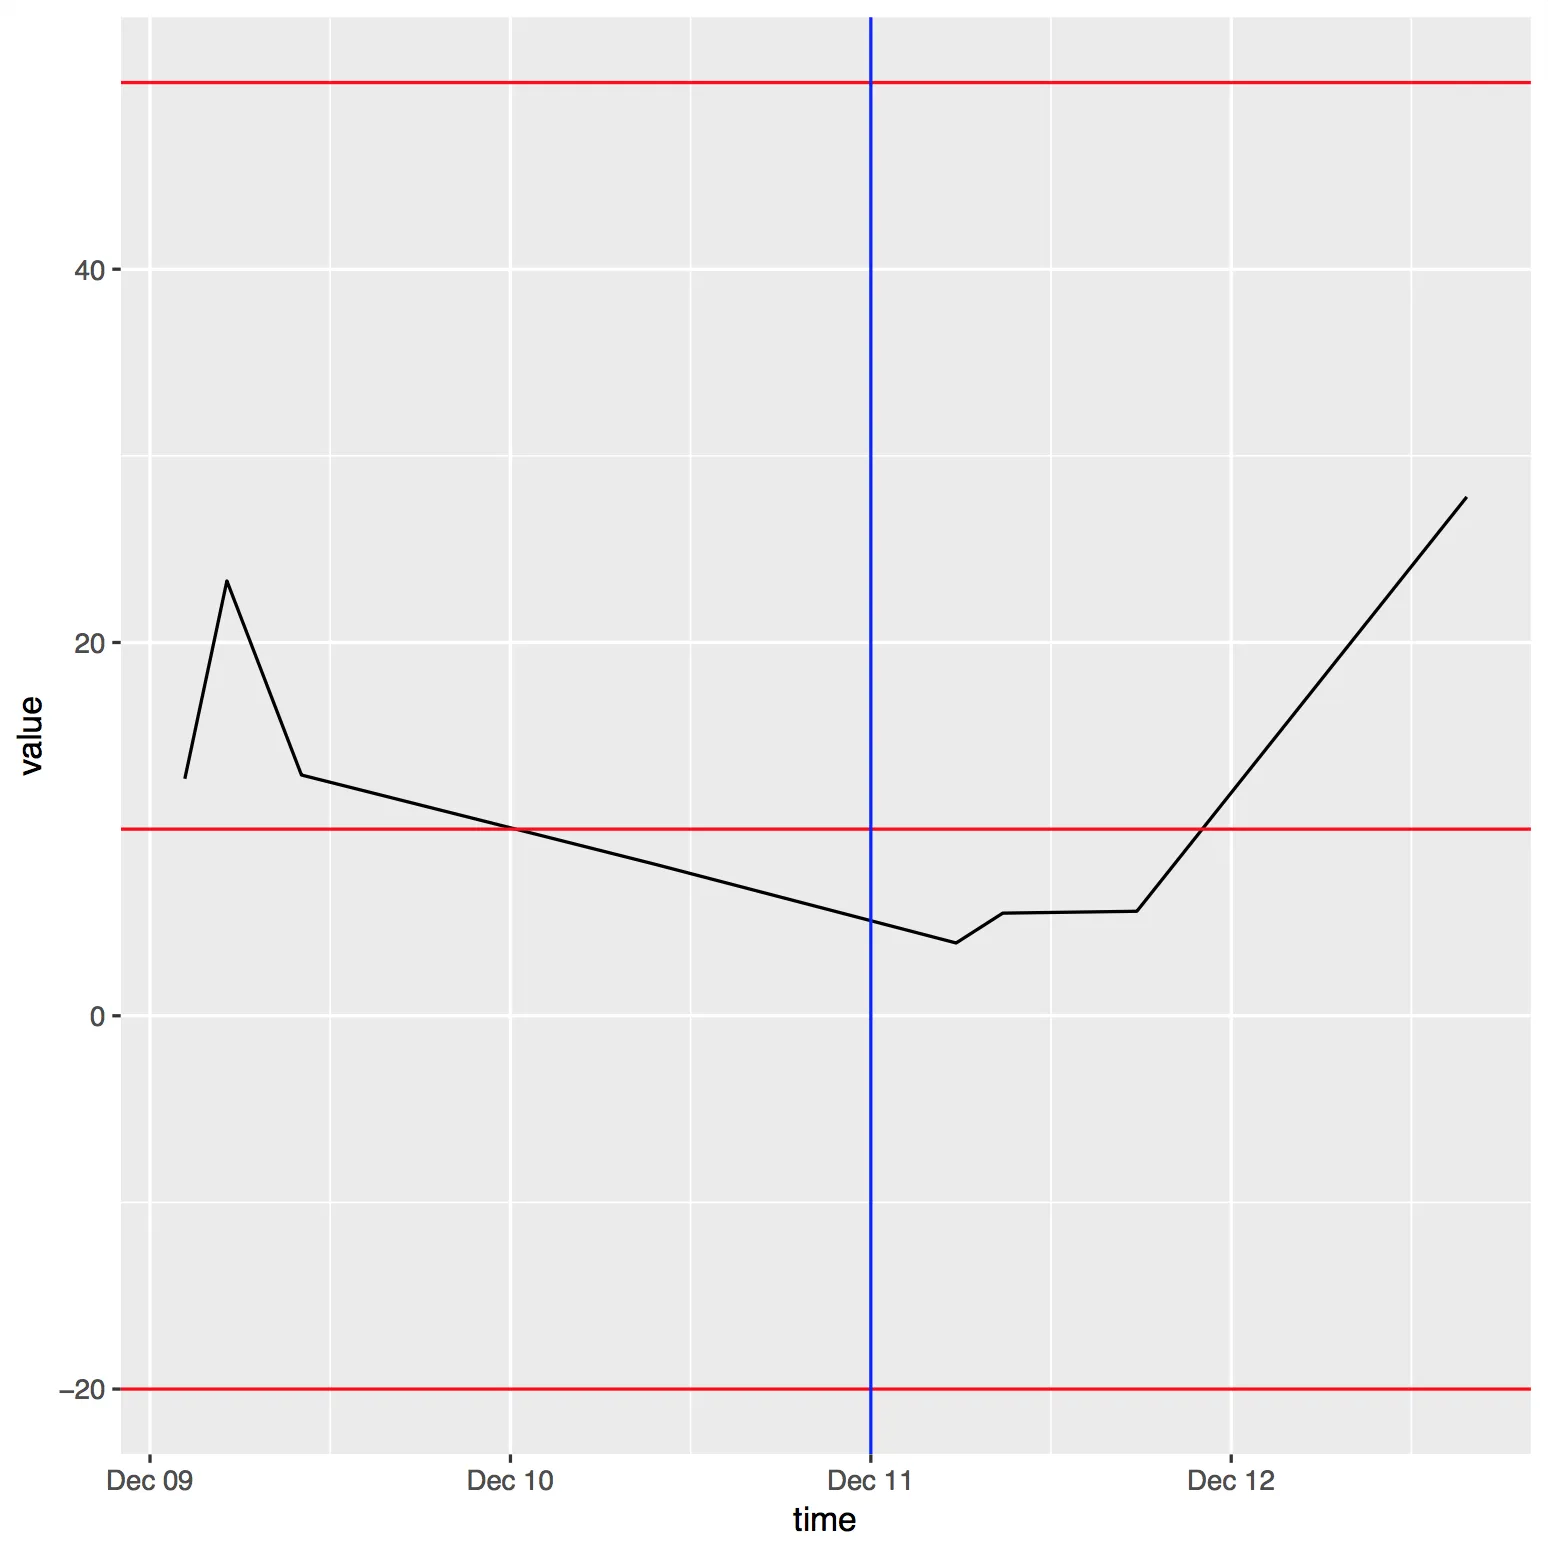
当我在图表中添加geom_hline()时,图表会被重新调整大小以适应它们。但是当我添加geom_vline()时,图表不会被重新调整大小。
为什么会这样?如何使图表重新调整大小?
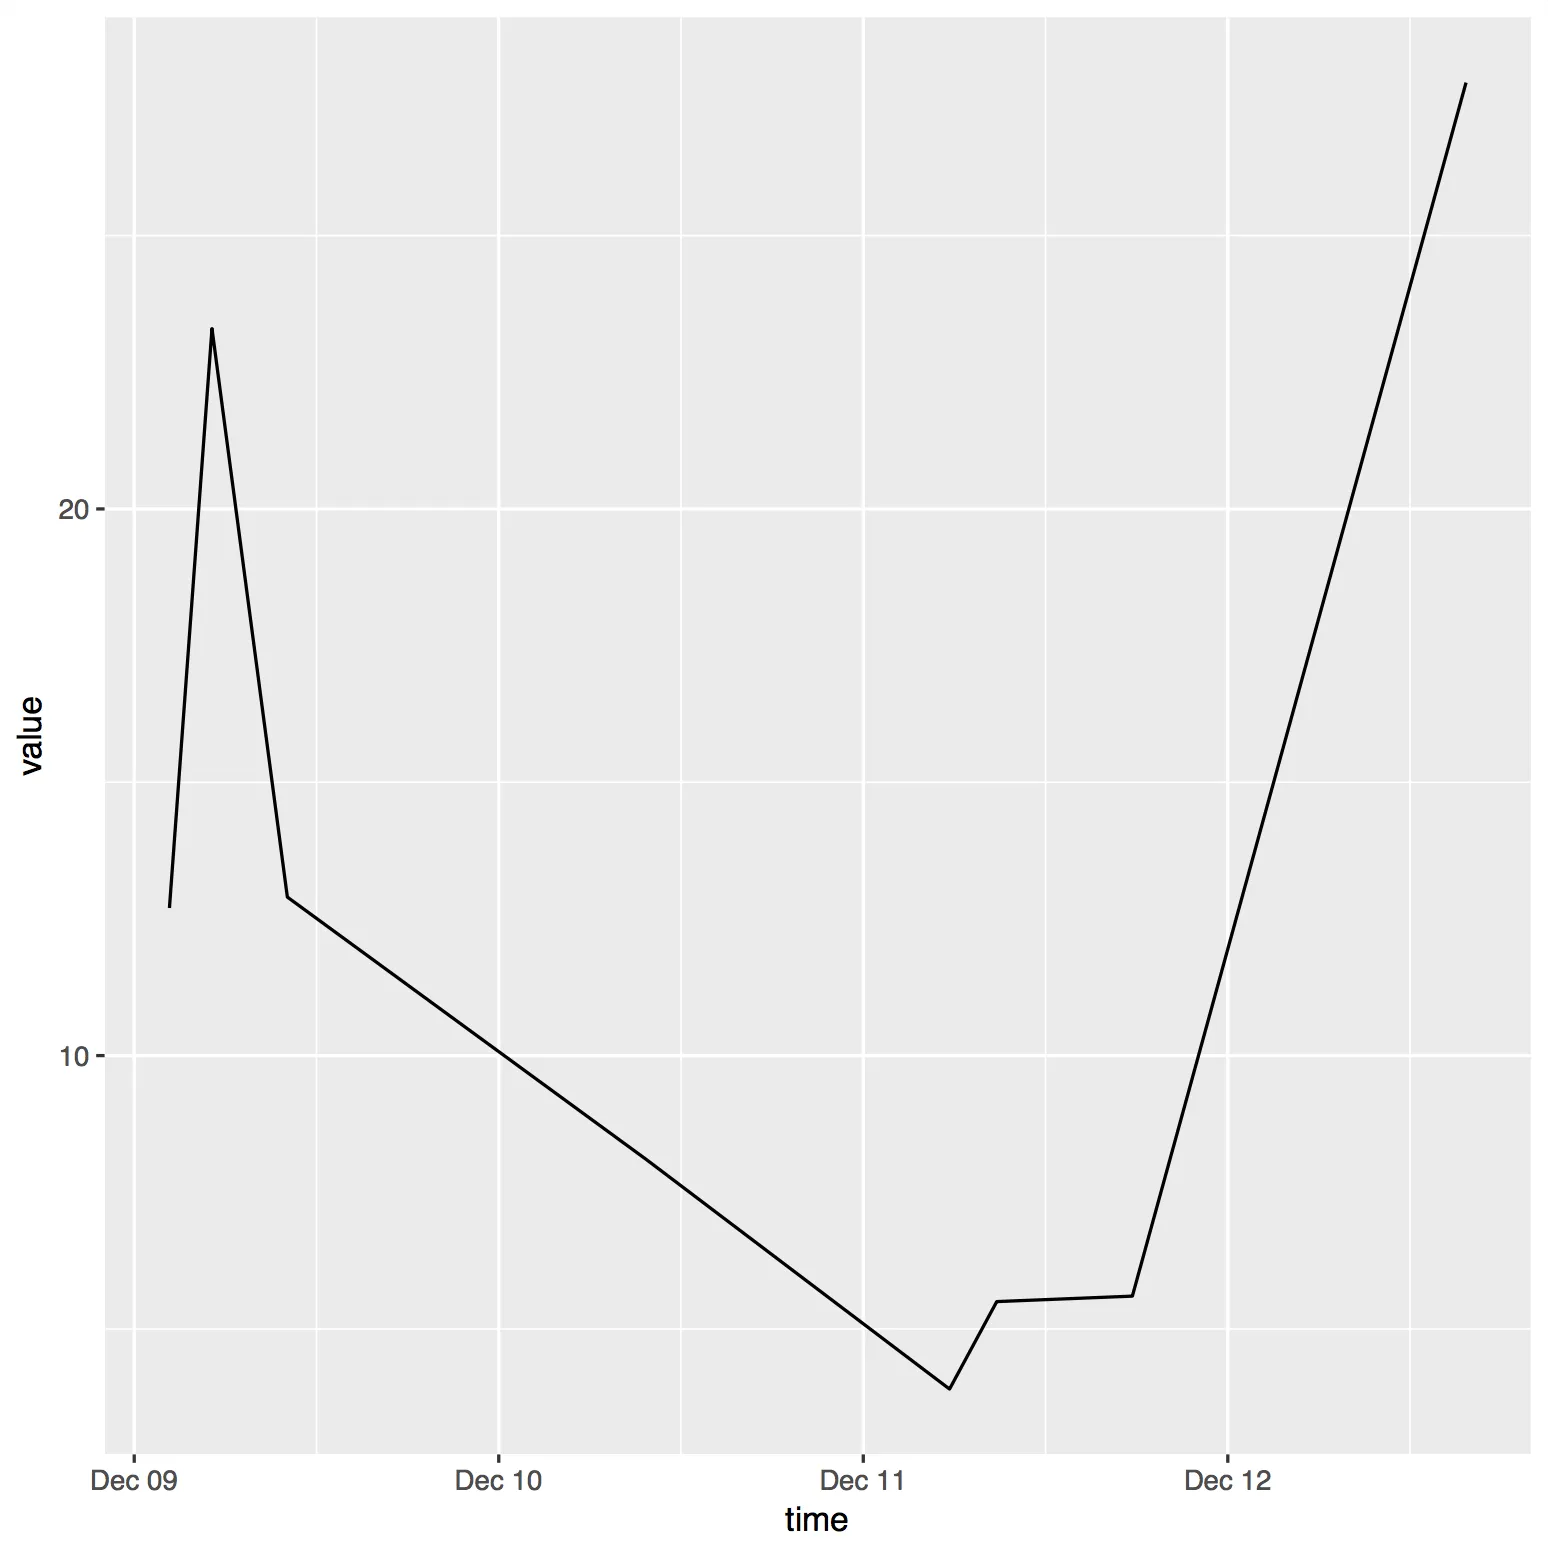
最小工作示例
library(ggplot2)

data <- data.frame(
  time=c(
    "2016-12-09T05:07:11Z", "2016-12-10T09:42:45Z", "2016-12-09T10:04:57Z",
    "2016-12-09T02:19:04Z", "2016-12-11T17:43:02Z", "2016-12-11T05:40:48Z",
    "2016-12-11T08:47:13Z", "2016-12-12T15:41:13Z"),
  value=c(23.3, 8.1, 12.9, 12.7, 5.6, 3.9, 5.5, 27.8)
)
# Each contains 3 values: 1 within the domain/range of `data` and 2 on either side
vlines <- data.frame(time=c("2016-12-07T00:00:00Z", "2016-12-11T00:00:00Z", "2016-12-14T00:00:00Z"))
hlines <- data.frame(value=c(-20, 10, 50))

data$time <- strptime(as.character(data$time), "%Y-%m-%dT%H:%M:%S", tz="UTC")
vlines$time <- strptime(as.character(vlines$time), "%Y-%m-%dT%H:%M:%S", tz="UTC")
vlines$timeNum <- as.numeric(vlines$time)

p <- ggplot(data, aes(x=time, y=value)) + geom_line()

ggsave("mwe1.pdf", p)

p <- p +
  geom_hline(data=hlines, aes(yintercept=value), color="red") +
  geom_vline(data=vlines, aes(xintercept=timeNum), color="blue")

ggsave("mwe2.pdf", p)
mwe1.pdf
mwe2.pdf
编辑:sessionInfo()
R version 3.3.3 (2017-03-06)
Platform: x86_64-apple-darwin13.4.0 (64-bit)
Running under: macOS Sierra 10.12.6

locale:
[1] en_US.UTF-8/en_US.UTF-8/en_US.UTF-8/C/en_US.UTF-8/en_US.UTF-8

attached base packages:
[1] stats     graphics  grDevices utils     datasets  base

other attached packages:
[1] ggplot2_2.2.1

loaded via a namespace (and not attached):
 [1] labeling_0.3     colorspace_1.3-2 scales_0.4.1     lazyeval_0.2.0
 [5] plyr_1.8.4       tools_3.3.3      gtable_0.2.0     tibble_1.3.3
 [9] Rcpp_0.12.12     grid_3.3.3       methods_3.3.3    rlang_0.1.1
[13] munsell_0.4.3
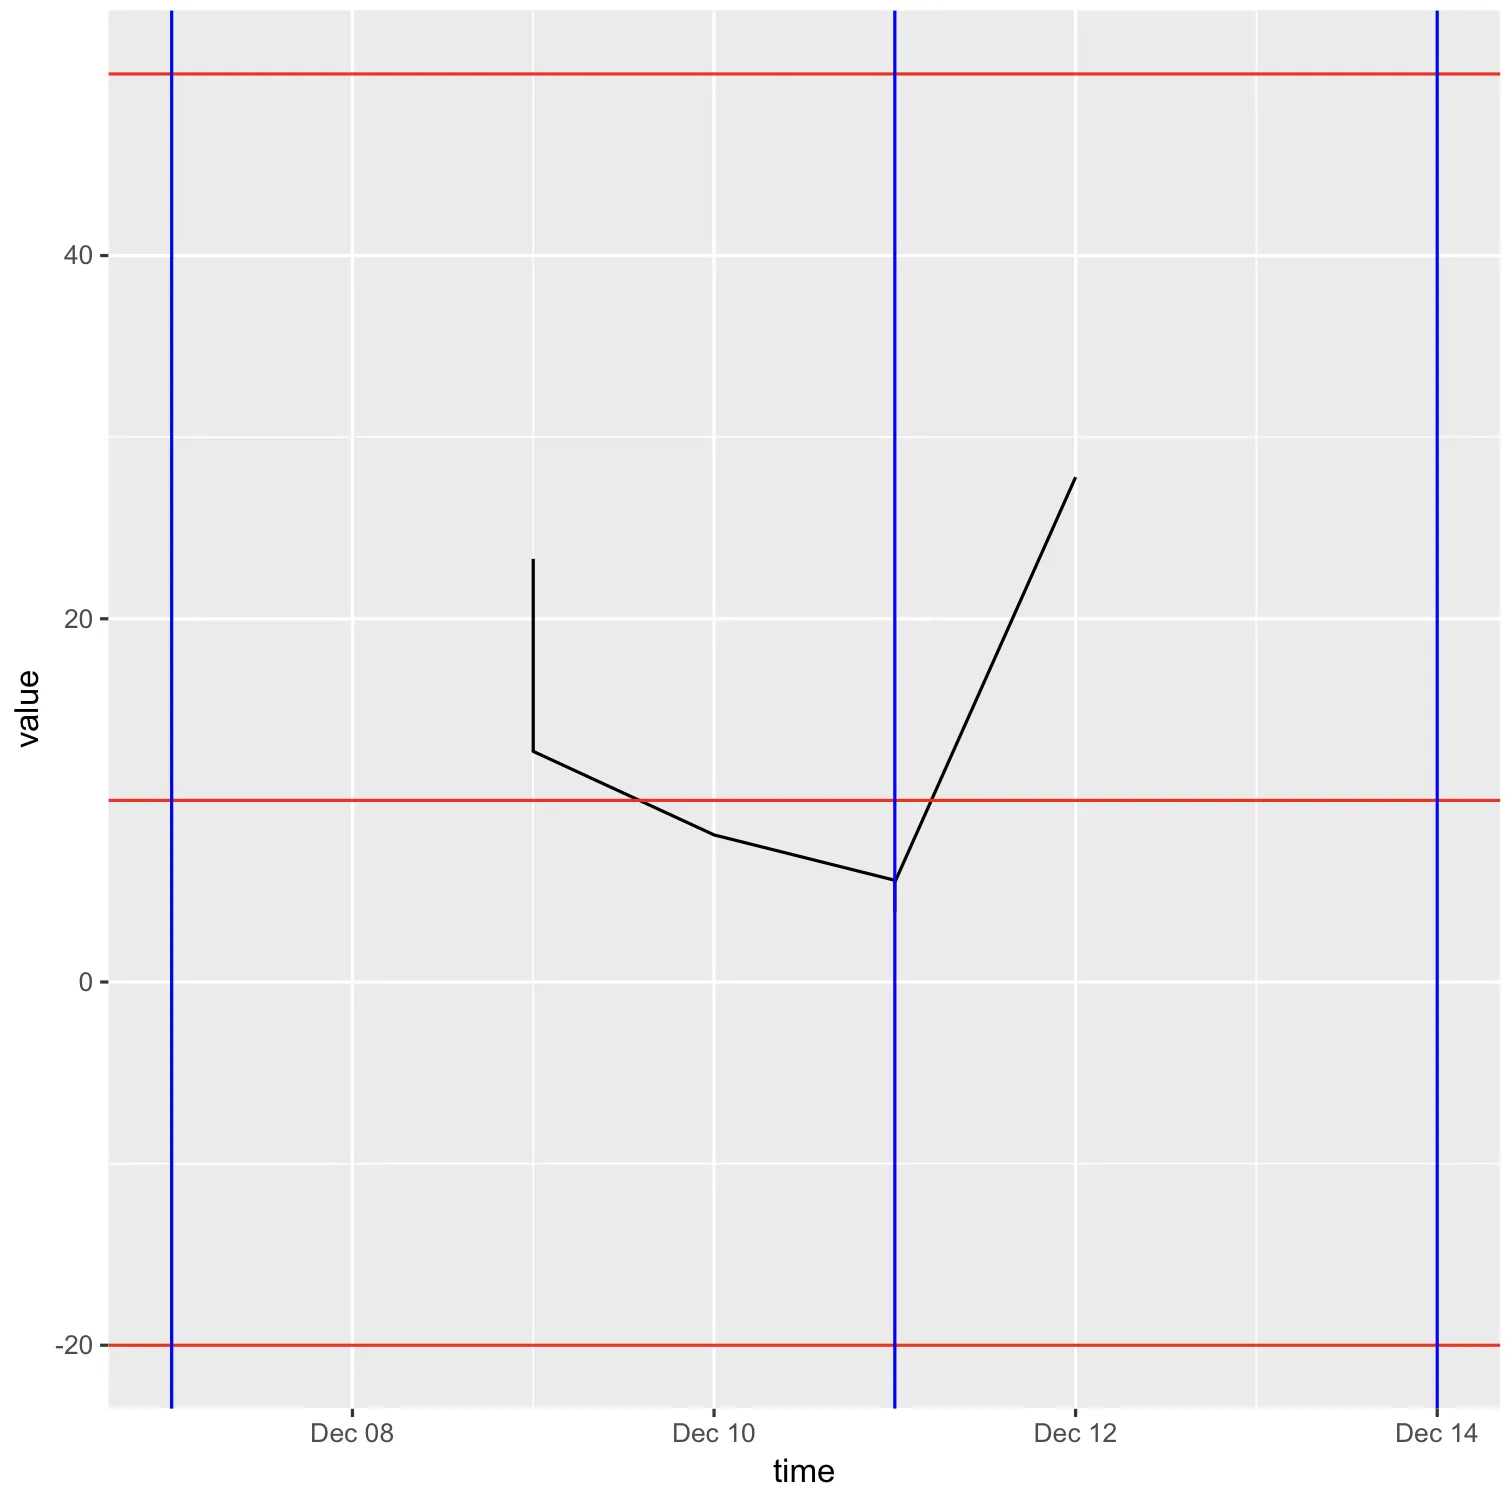
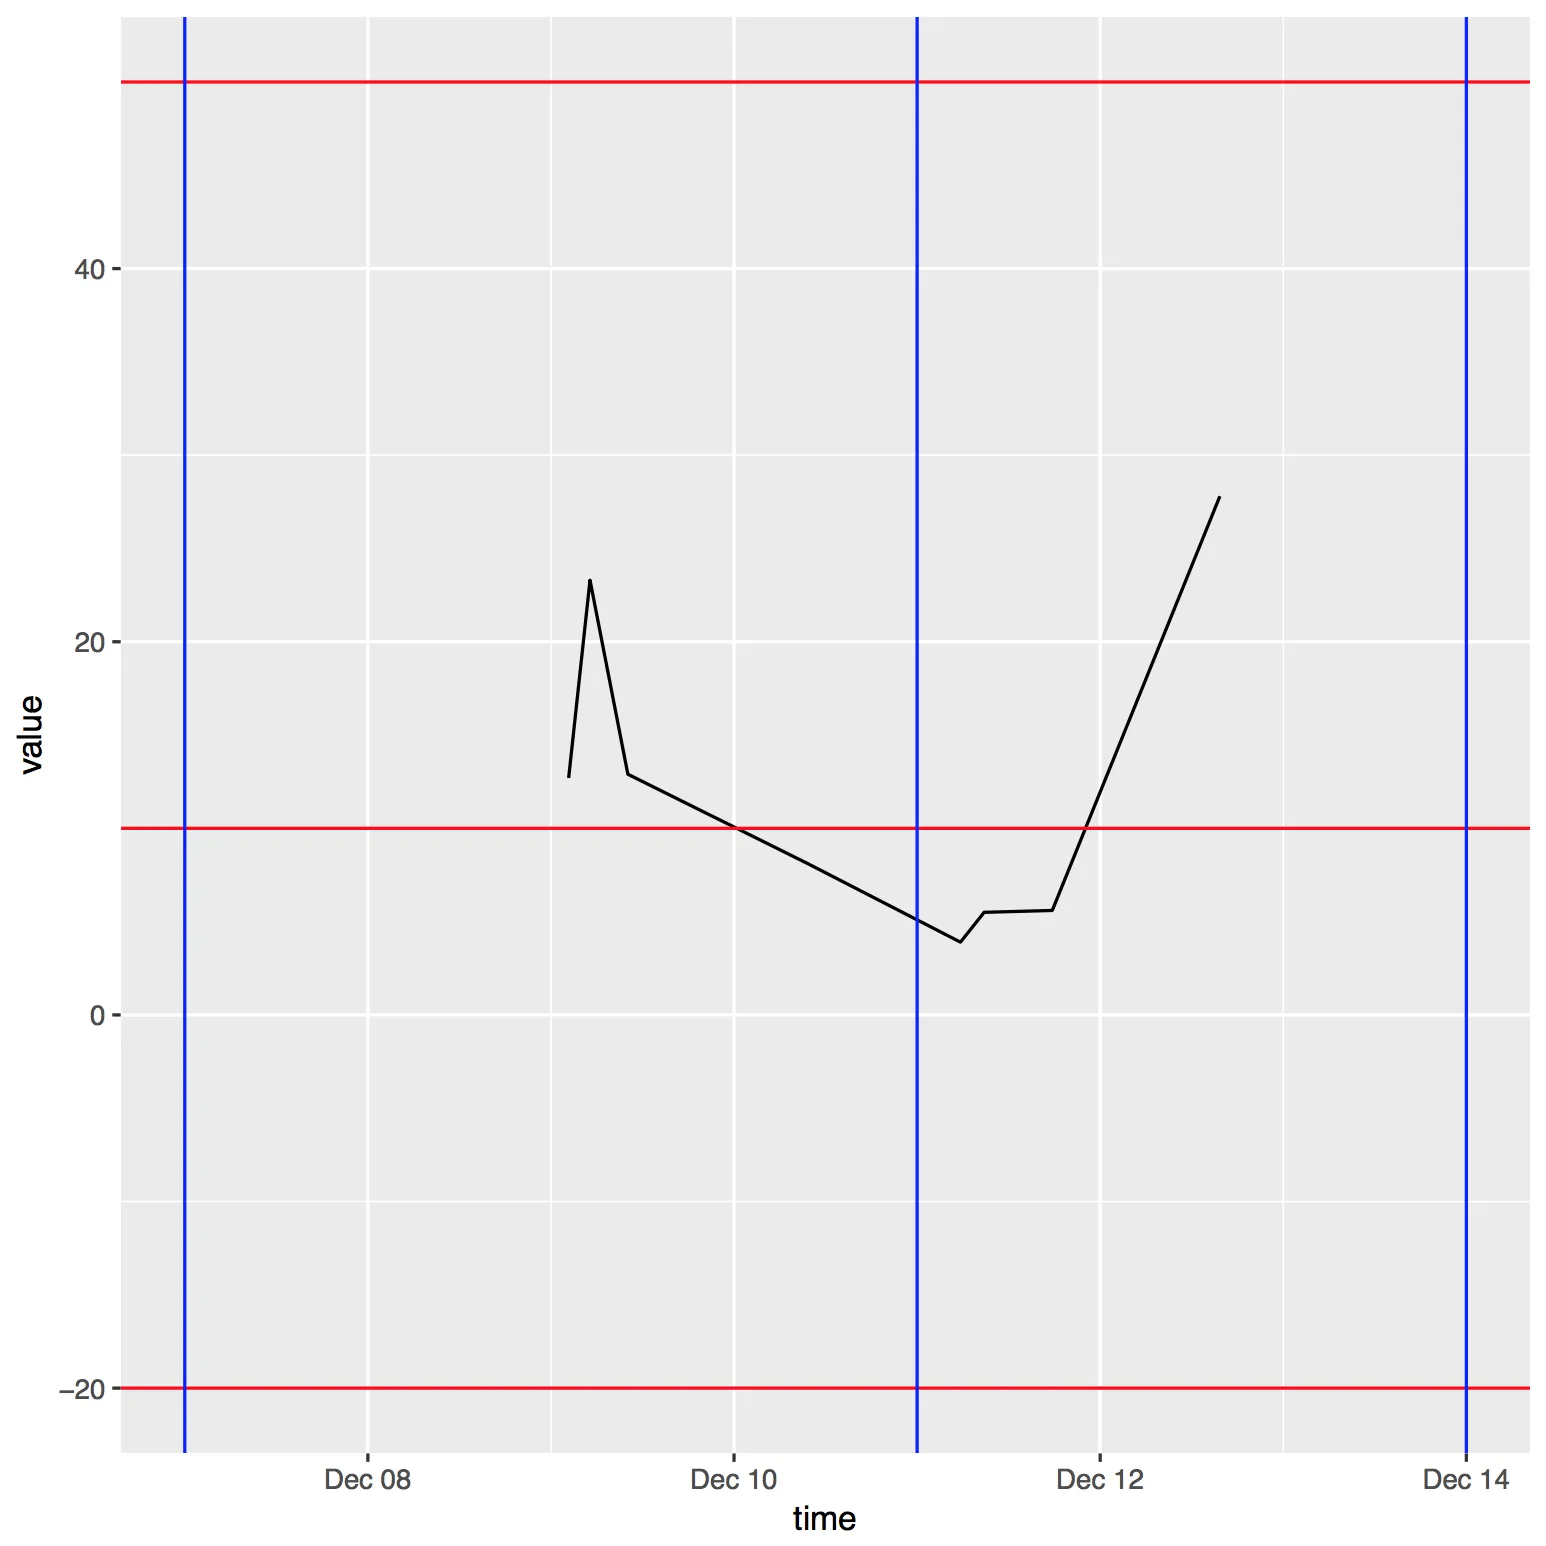
2016-12-07和2016-12-14的垂直线可见。X轴应该在这两个点之前/之后稍微开始/结束(取决于如何设置“expand”参数,我认为它控制这个)。 - hhquark