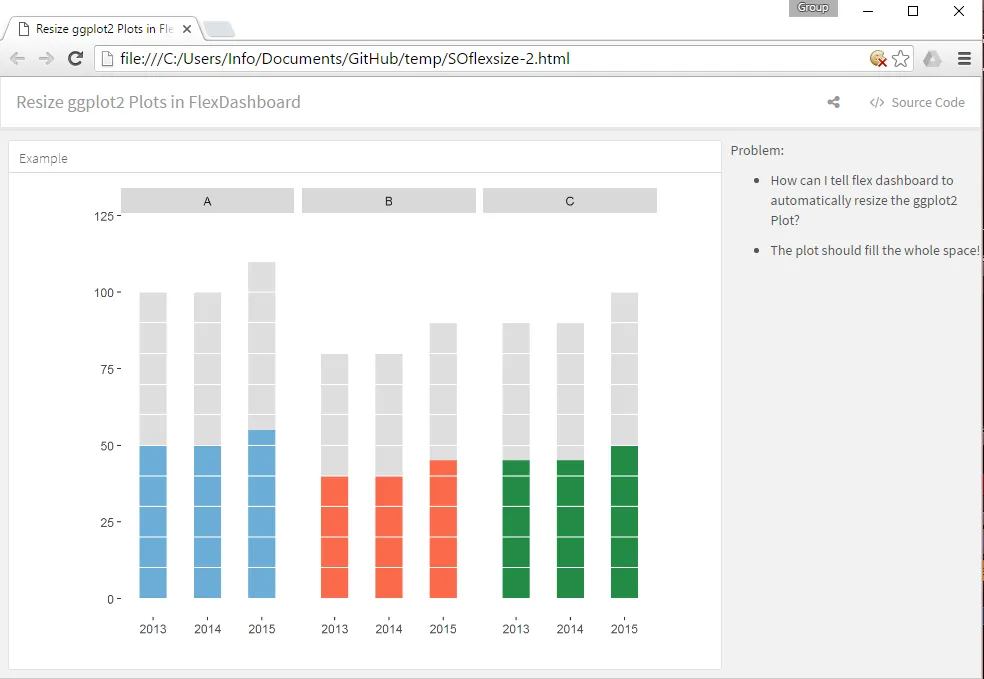
我有一个Flexdashboard只有一个框架。现在我遇到了两个问题:
第一个,如何改变框架标题("Example")的大小?
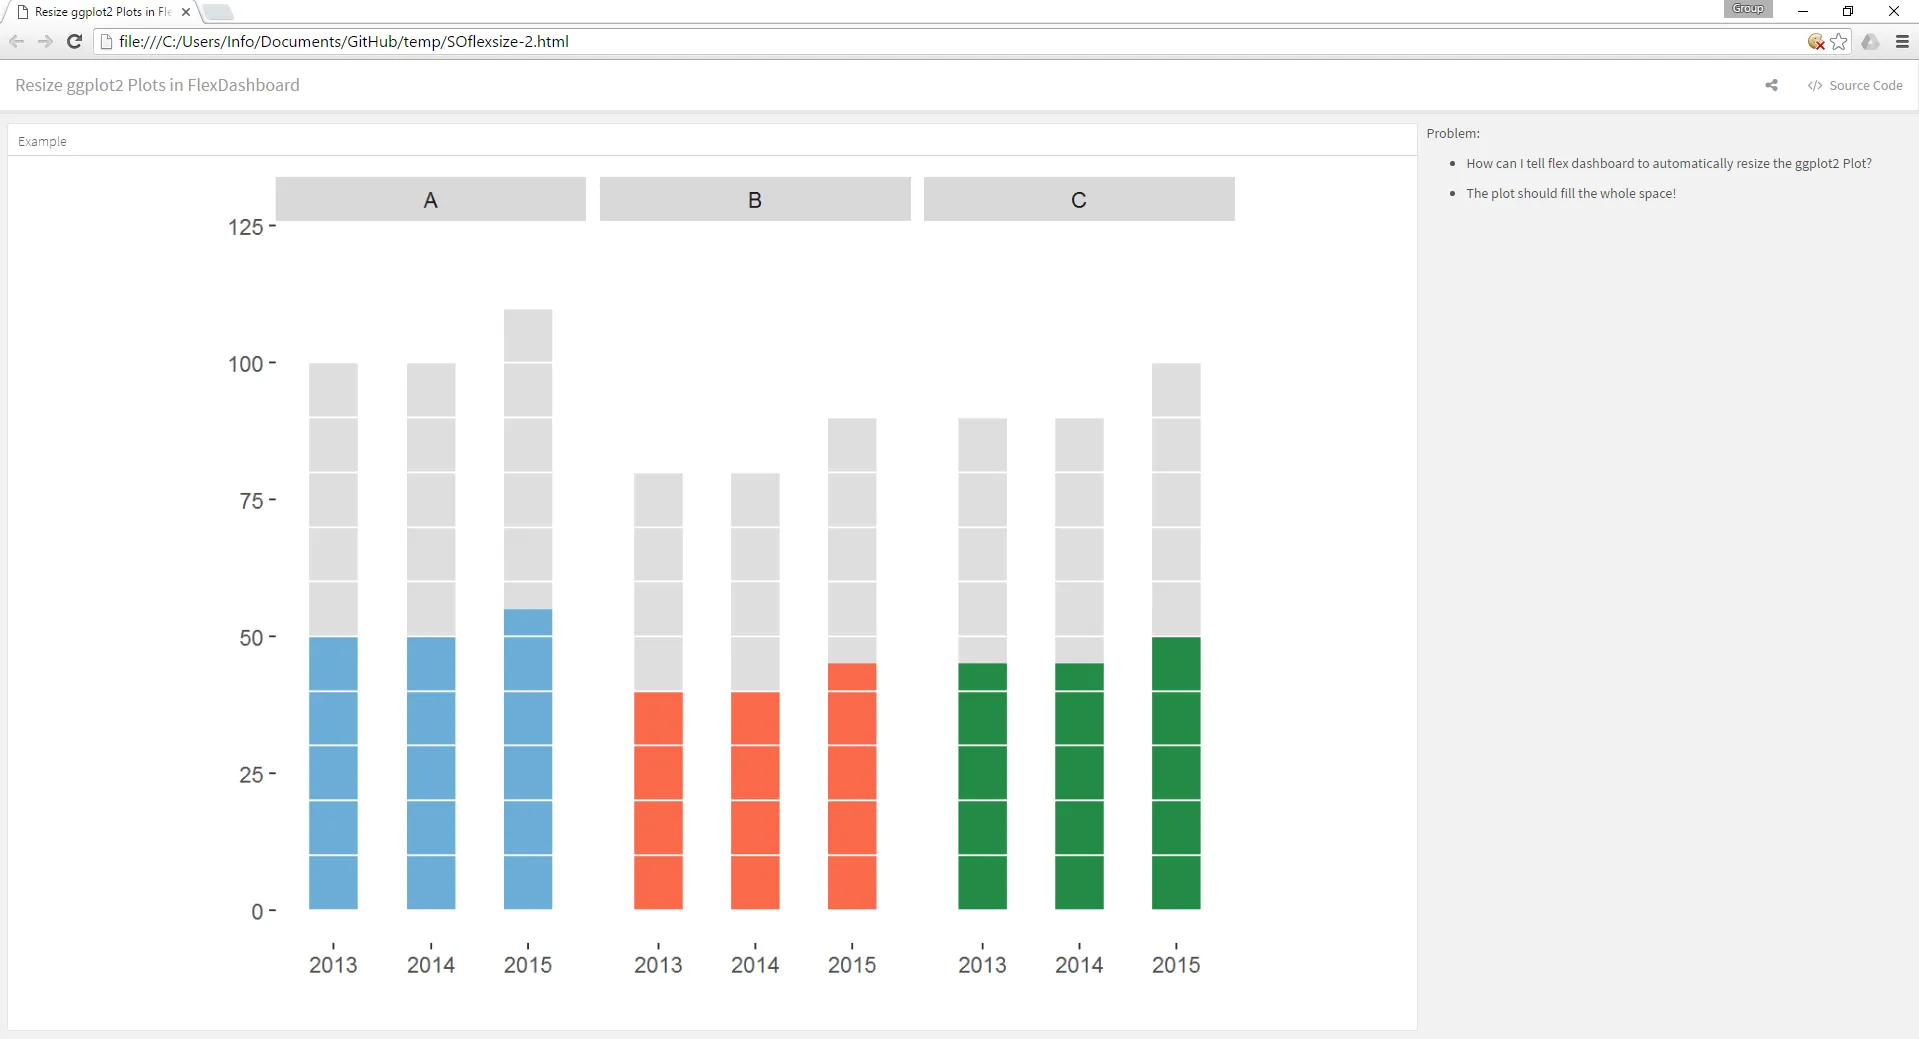
第二个,仪表板在浏览器中自动调整大小。但是,ggplot2图表没有自动调整。如何告诉flexdashboard自动调整此图表的大小?
---
title: "Resize ggplot2 Plots in FlexDashboard"
output:
  flexdashboard::flex_dashboard:
    storyboard: true
    theme: lumen
    social: menu
    source: embed
---

```{r setup, include=FALSE}
require(flexdashboard)
require(ggplot2)
df <- data.frame(year = c("2013", "2014", "2015", "2013", "2014", "2015", "2013", "2014", "2015"),
                 cat = c("A", "A", "A", "B", "B", "B", "C", "C", "C"),
                 freqA = c(100, 100, 110, 80, 80, 90, 90, 90, 100),
                 freqB = c(50, 50, 55, 40, 40, 45, 45, 45, 50))
```

### Example

```{r}
ggplot(df, aes(x = year, weight = freqA)) +
        geom_bar(position="dodge", alpha = .2, width=.5) +
        # add and overlay elements
        geom_bar(aes(x = year, weight = freqB, fill = cat),
                 position = "dodge", width=.5) +
        scale_fill_manual(values = c("#6baed6", "#fb6a4a", "#238b45")) +
        # add hlines for waffle-design
        geom_hline(yintercept=seq(0, 120, by = 10), col = 'white') +
        # facet display - 1 row, 3 columns
        facet_grid(. ~ cat) +
        # delete labels of x- and y-axis
        xlab("") + ylab("") +
        # blank background and now grids and legend
        theme(panel.grid.major.x = element_blank(), panel.grid.major.y = element_blank(),
              panel.grid.minor.y = element_blank(),
              panel.background = element_blank(), legend.position = "none",
              axis.text.x = element_text(angle = 0, hjust = 0.5))
```


***

Problem:

- How can I tell flex dashboard to automatically resize the ggplot2 Plot?

- The plot should fill the whole space!