我用R创建了一个plotly图表,然后通过htmlwidget保存图表,以便在slidify中调用。我尝试在
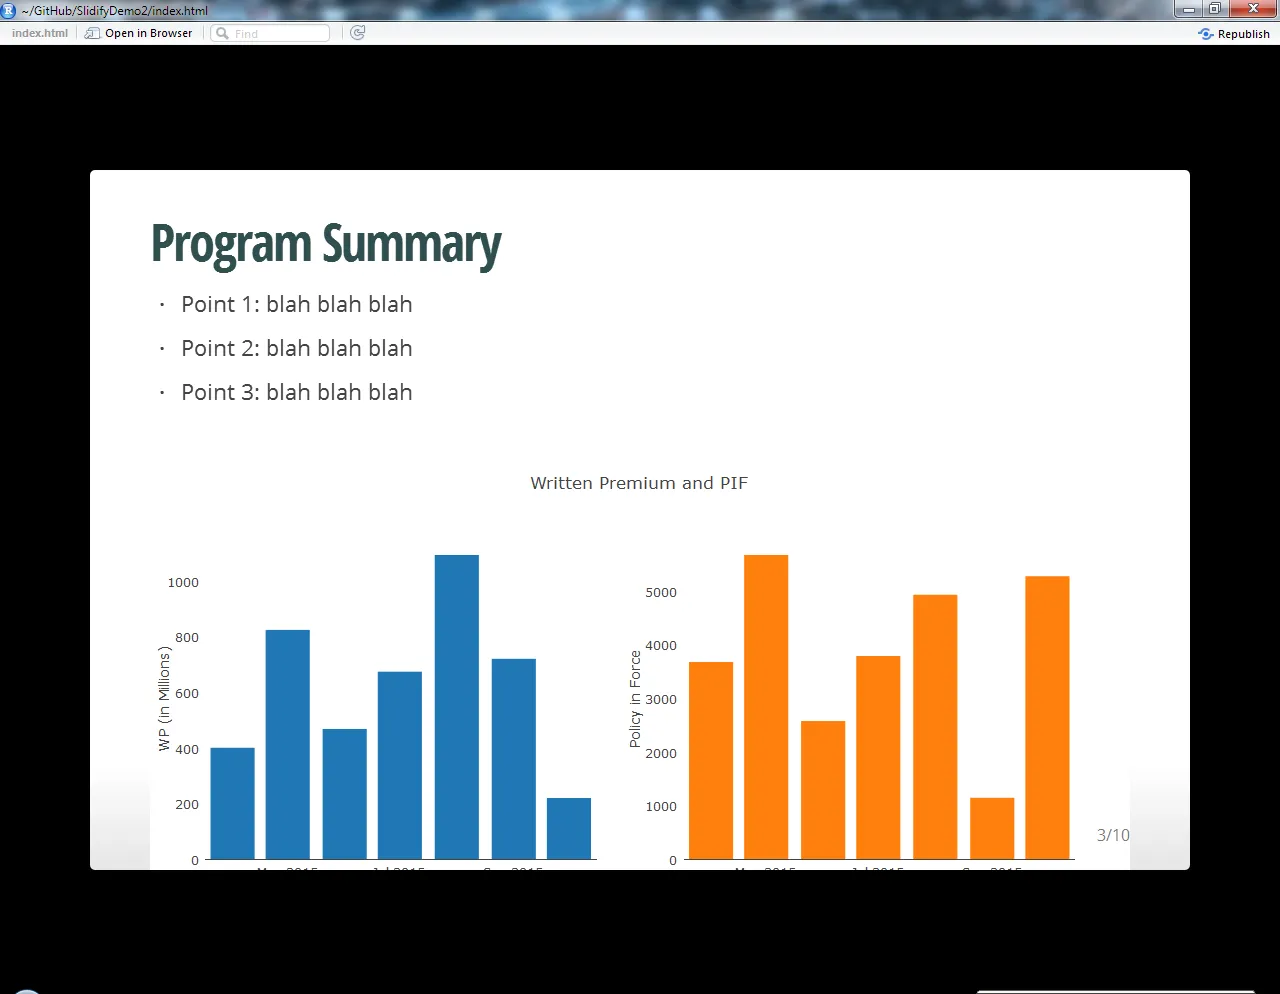
如何真正调整slidify中plotly图表的大小?
R脚本中的代码
layout和index.Rmd的width和height参数中进行调整,以使图表适应slidify幻灯片,但最终结果总是在添加一些文本时剪切图表底部的部分。如何真正调整slidify中plotly图表的大小?
R脚本中的代码
## first slide
date <- seq(from = as.POSIXct("2015/4/1"),
            to = as.POSIXct("2015/10/1"),
            by = "month")

as.Date(date, "%Y/%m/%d")

set.seed(2016)
tot.prem <- runif(n = 7, min = 0, max = 1200)
pol.frce <- runif(n = 7, min = 0, max = 6000)
tot.data <- cbind(date, tot.prem, pol.frce)
tot.data <- data.frame(Date = as.POSIXct(date, format = "%Y/%m/%d"),
                  WP = tot.prem,
                  PIF = pol.frce)

m = list(
  l = 50,
  r = 50,
  b = 100,
  t = 100,
  pad = 4
)

p1 <- tot.data %>%
  subplot(plot_ly(x = date, y = tot.prem, type = "bar"),
          plot_ly(x = date, y = pol.frce, type = "bar"), margin = 0.05) %>%
  layout(showlegend = FALSE,
         title = "Written Premium and PIF",
         yaxis = list(title = "WP (in Millions)", showgrid = FALSE),
         xaxis = list(title = "Date"),
         yaxis2 = list(title = "Policy in Force", showgrid = FALSE),
         xaxis2 = list(title = "Date"),
         autosize = F, width = 600, height = 400, margin = m
         )
p1
# saveWidget(dplot, 'plotlyex1.html')
htmlwidgets::saveWidget(as.widget(p1), "wp.html")
index.Rmd摘录
## Program Summary

- Point 1: blah blah blah
- Point 2: blah blah blah
- Point 3: blah blah blah

```{r wp, echo=FALSE, warning=FALSE, cache=FALSE, results='asis'}
cat('<iframe src="./assets/widgets/wp.html" width=100% height=10% allowtransparency="true"> </iframe>')
```

---
幻灯片