您可以使用
$params$width 和
$params$height 选项来调整您的绘图大小。 使用
column(9 声明一个类为
span9 ,与您的
span6 调用不兼容。 您可以使用CSS样式选项来对齐您的内容:
library(rCharts)
library(shiny)
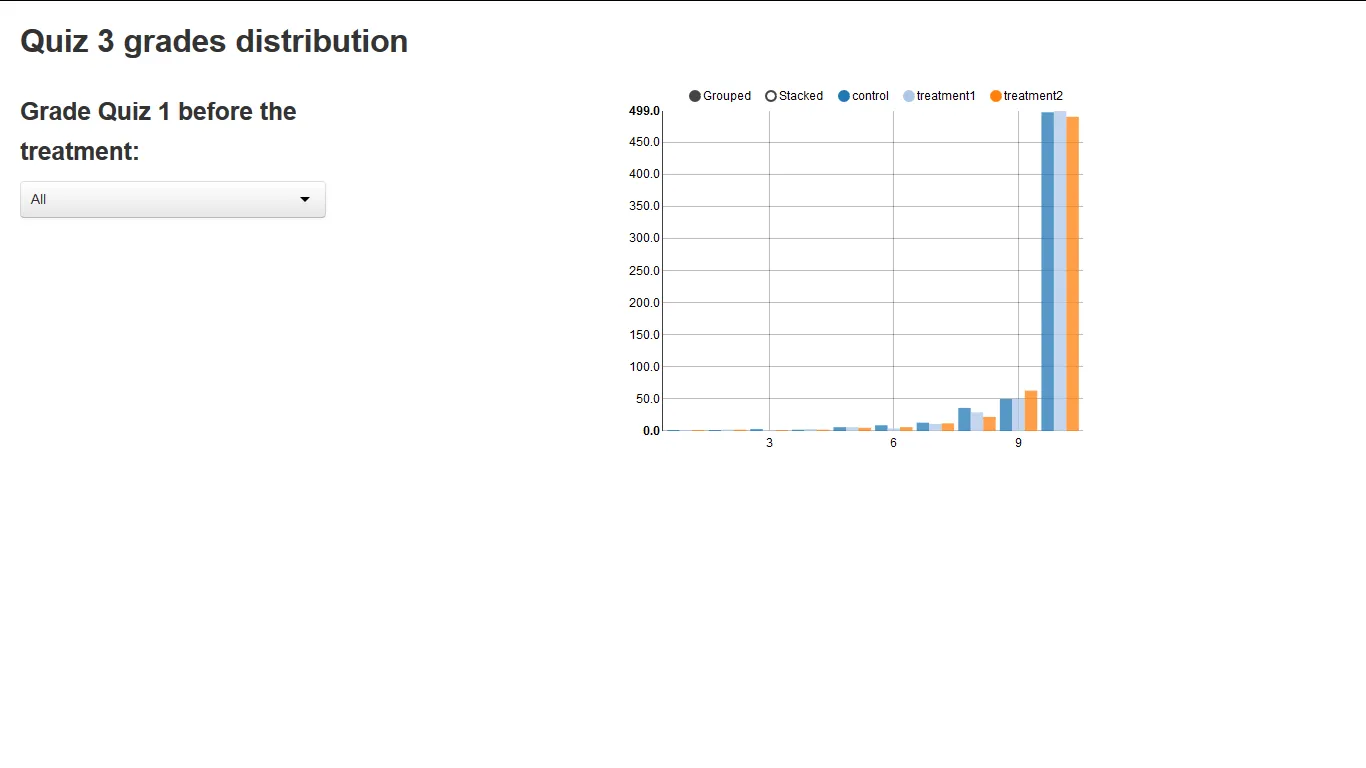
X <- data.frame(Var1 = c(1L, 2L, 3L, 4L, 5L, 6L, 7L,8L, 9L, 10L, 1L, 2L, 3L, 4L, 5L, 6L, 7L, 8L, 9L, 10L, 1L, 2L,3L, 4L, 5L, 6L, 7L, 8L, 9L, 10L),
Var2 = structure(c(1L,1L, 1L, 1L, 1L, 1L, 1L, 1L, 1L, 1L, 2L, 2L, 2L, 2L, 2L, 2L, 2L,2L, 2L, 2L, 3L, 3L, 3L, 3L, 3L, 3L, 3L, 3L, 3L, 3L), .Label = c("control","treatment1", "treatment2"), class = "factor"),
Freq = c(0L,0L, 3L, 2L, 6L, 9L, 13L, 36L, 50L, 497L, 0L, 2L, 1L, 3L, 6L, 4L, 11L, 29L, 50L, 499L, 1L, 2L, 0L, 2L, 5L, 6L, 12L, 22L, 63L,490L)
)
runApp(
list(ui = fluidPage(
titlePanel("Quiz 3 grades distribution"),
fluidRow(
column(3,
selectInput("select", label = h3("Grade Quiz 1 before the treatment:"),
choices = list("All" = 0, "Not Perfect" = 1, "Perfect" = 2),
selected = 0)
),
column(9, div(showOutput("histogram","nvd3")), style = 'align:center;')
)
),
server = shinyServer(
function(input, output, session) {
output$histogram <- renderChart2({
n2 <- nPlot(Freq ~ Var1, group = 'Var2', data = X, type = 'multiBarChart')
n2$params$width <- 500
n2$params$height <- 400
n2
})
}
)
)
)
runApp来实现此目的。 - jdharrison