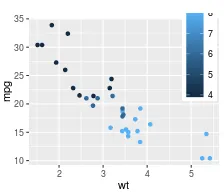
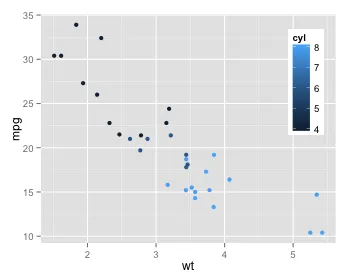
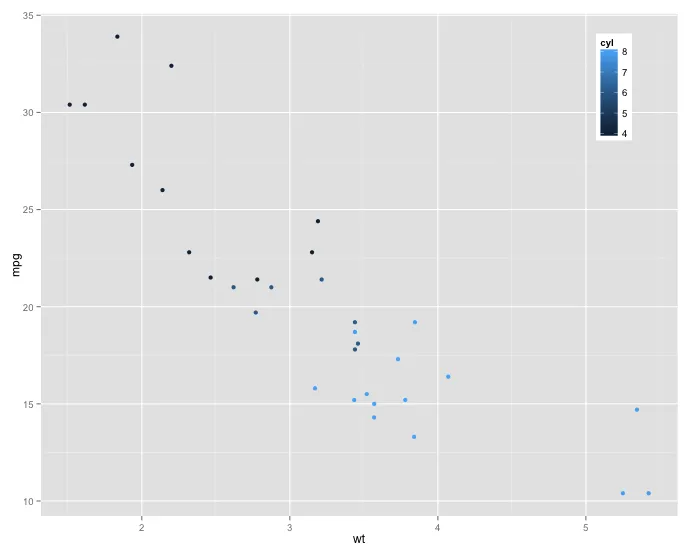
在ggplot2中,元素的大小是单独指定的。当图形的大小改变时,例如图例不会改变大小。这可能是Shiny应用程序的一个问题,因为输出的ggplot2图形大小随浏览器窗口的变化而改变。以下是一个虚拟的Shiny应用程序代码和两个在不同浏览器窗口大小下的输出图形。较小的图形因为其图例的一部分被切断而显得难看。
在ggplot2中是否有一种方法可以直接缩放图例大小以与图形大小相对应,而无需预先将图形保存为图像文件用于Shiny应用程序?
library(shiny)
library(ggplot2)

ui <- fluidPage(
    br(), br(), br(),
    plotOutput("test", height = "auto")
)

server <- function(input, output, session) {
    output$test <- renderPlot(
        height = function() {
            0.8 * session$clientData$output_test_width
        },
        expr = {
            aaa <- ggplot(mtcars, aes(wt, mpg, color = cyl)) +
                geom_point() +
                theme(legend.position = c(0.9, 0.9))
            print(aaa)
        }
    )
}

shinyApp(ui, server)
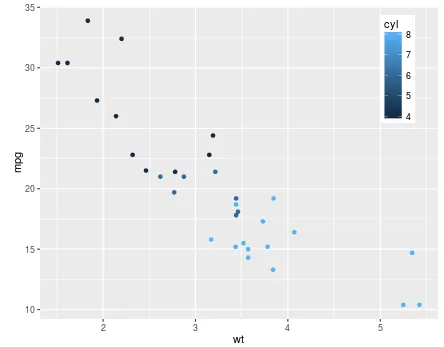 。但在小浏览器窗口中,图例的顶部没有显示出来: