用排序将点形成连续的线

43

我有一个由(x,y)坐标表示的线骨架列表。该列表直接从二进制图像中获取:

import numpy as np    
list=np.where(img_skeleton>0)

现在,列表中的点按照它们在图像上沿其中一个轴的位置进行排序。

我想要对列表进行排序,使得顺序代表线上的平滑路径(当前情况下线会弯曲回来)。 随后,我想要对这些点进行样条拟合。

一个类似的问题已经使用arcPy 在这里被描述和解决。是否有方便的方法可以使用Python、NumPy、SciPy、OpenCV(或其他库)来实现这一点?

下面是一个示例图像,它将生成一个由59个(x,y)坐标组成的列表: enter image description here

当我将列表发送到SciPy的样条拟合程序时,我遇到了一个问题,因为点没有在线上'排序':

enter image description here


你能澄清一下你的意思以及我该如何去做吗?最终,我只关心能否通过骨架图像中的非零像素拟合样条曲线。 - jlarsch
1
你可能正在寻找“最近邻排序”函数,这是一个不错的搜索词 :) - Torxed
1
这个问题等价于在一个图中找到最短路径,其中该图被创建为完全连接的图(其中您的点是节点),边缘按点之间的欧几里得距离加权。 - Imanol Luengo
1
以下任何答案都没有解决实际问题,即从图像中提取点的方式。提取正确顺序的点非常简单,可以导致比下面任何解决方案更有效的算法。 - Cris Luengo
1
实现这个目标的起点是什么? - jlarsch
显示剩余6条评论
6个回答

42
事先抱歉我会回答比较长:P(问题并不简单)。
首先,让我们重新阐述这个问题。寻找连接所有点的直线可以重构为在图中求最短路径的问题。其中,(1)图节点是空间中的点,(2)每个节点与其两个最近的邻居相连,且(3)最短路径仅通过每个节点一次。最后一个约束条件非常重要(也很难优化)。基本上,问题是要找到长度为N的排列,其中排列引用路径中每个节点的顺序(N是节点总数)。
找到所有可能的排列并评估它们的成本太昂贵了(如果我没记错的话,有N!种排列,这对于问题来说太大了)。以下我提出了一种方法,该方法找到N个最佳排列(每个节点的最优排列),然后找到(从这些N个排列中)最小化误差/成本的排列。
1. 创建具有无序点的随机问题
import matplotlib.pyplot as plt
import numpy as np

x = np.linspace(0, 2 * np.pi, 100)
y = np.sin(x)

plt.plot(x, y)
plt.show()

在此输入图片描述

这里是未排序的点[x, y]版本,模拟了空间中随机连接成线的点:

idx = np.random.permutation(x.size)
x = x[idx]
y = y[idx]

plt.plot(x, y)
plt.show()

enter image description here

问题在于如何对这些点进行排序,以恢复它们的原始顺序,以便正确绘制线条。

2. 在节点之间创建2-NN图

我们可以先将这些点重新排列成一个[N, 2]的数组:

points = np.c_[x, y]

接下来,我们可以先创建一个最近邻图,将每个节点连接到其两个最近的邻居:

from sklearn.neighbors import NearestNeighbors

clf = NearestNeighbors(2).fit(points)
G = clf.kneighbors_graph()

G是一个稀疏的N x N矩阵,其中每一行代表一个节点,列的非零元素表示到这些点的欧几里得距离。

我们可以使用networkx从这个稀疏矩阵构建图:

import networkx as nx

T = nx.from_scipy_sparse_matrix(G)

3. 查找源节点到目标节点的最短路径

接下来,我们将展示一项神奇的技能:使用dfs_preorder_nodes函数,可以从一个起点开始创建一条穿过所有节点的路径(每个节点仅被经过一次),并将这些路径提取出来(如果没有给定起点,则默认选择节点0作为起点)。

order = list(nx.dfs_preorder_nodes(T, 0))

xx = x[order]
yy = y[order]

plt.plot(xx, yy)
plt.show()

enter image description here

这张图看起来还不错,但我们可以发现重构并不是最优的。这是因为无序列表中的点0位于线的中心位置,所以它首先向一个方向移动,然后返回并在另一个方向结束。

4. 寻找所有源节点中成本最小的路径

因此,为了获得最佳顺序,我们只需获取所有节点的最佳顺序:

paths = [list(nx.dfs_preorder_nodes(T, i)) for i in range(len(points))]

现在我们已经得到了从每个节点开始的最佳路径,接下来我们可以舍弃它们,并找到使连接之间距离最小的路径(优化问题):

mindist = np.inf
minidx = 0

for i in range(len(points)):
    p = paths[i]           # order of nodes
    ordered = points[p]    # ordered nodes
    # find cost of that order by the sum of euclidean distances between points (i) and (i+1)
    cost = (((ordered[:-1] - ordered[1:])**2).sum(1)).sum()
    if cost < mindist:
        mindist = cost
        minidx = i

对于每条最优路径,点会按顺序排列,然后计算成本(通过计算所有点对ii+1之间的欧几里得距离)。如果路径从起点或终点开始,它将具有最小的成本,因为所有节点都是连续的。另一方面,如果路径从线段中间的节点开始,成本在某些时候会非常高,因为它需要从线段的末端(或开头)到达初始位置以探索其他方向。最小化该成本的路径是从最佳点开始的路径。

opt_order = paths[minidx]

现在,我们可以正确地重建顺序:
xx = x[opt_order]
yy = y[opt_order]

plt.plot(xx, yy)
plt.show()

enter image description here


1
@jlarsch 我已经编辑了这篇文章,添加了标题以使其更加清晰。本质上,如果您已经知道startend节点之一,则第3节提供了一个使用nx.dfs_preorder_nodes(T, start_index)的1行解决方案。如果您不知道(或不想手动提供)初始节点,则第4节将使用每个节点作为源计算所有可能的最小路径,并过滤具有最小成本的路径。 - Imanol Luengo
1
这行代码 paths = [list(nx.dfs_preorder_nodes(T, i)) for i in range(len(points))] 在某些情况下生成的路径大小比 len(points) 小,导致排序错误。这是为什么? - learn2day
通过查询T的度数,例如endidx=np.where(T.degree().values()==1),是否可能找到终点/节点?通常情况下,端点的度数应为1,除非线条两端不太直。 - Jason
我认为这是因为她的数据分布太不均匀了,在线上有一个很大的间隙,sklearn包找到的两个最近邻居在间隙的同一侧而不是两侧,所以线被分成了两部分,这就是为什么结果图由两条线组成(一条长度为44,另一条长度为6)。我有点觉得她的解决方案更加健壮,类似于区域增长,但在这种情况下是线性增长搜索。 - Jason
1
该方法对于嘈杂的数据不够健壮,在图构建阶段会失败。 - Eugene W.
显示剩余8条评论

7

一种可能的解决方案是使用最近邻方法,可以使用KDTree实现。Scikit-learn提供了一个良好的接口。然后可以使用networkx构建图表示。如果要绘制的线应该通过最近邻,则这只有在最近邻方面真正起作用:

from sklearn.neighbors import KDTree
import numpy as np
import networkx as nx

G = nx.Graph()  # A graph to hold the nearest neighbours

X = [(0, 1), (1, 1), (3, 2), (5, 4)]  # Some list of points in 2D
tree = KDTree(X, leaf_size=2, metric='euclidean')  # Create a distance tree

# Now loop over your points and find the two nearest neighbours
# If the first and last points are also the start and end points of the line you can use X[1:-1]
for p in X
    dist, ind = tree.query(p, k=3)
    print ind

    # ind Indexes represent nodes on a graph
    # Two nearest points are at indexes 1 and 2. 
    # Use these to form edges on graph
    # p is the current point in the list
    G.add_node(p)
    n1, l1 = X[ind[0][1]], dist[0][1]  # The next nearest point
    n2, l2 = X[ind[0][2]], dist[0][2]  # The following nearest point  
    G.add_edge(p, n1)
    G.add_edge(p, n2)


print G.edges()  # A list of all the connections between points
print nx.shortest_path(G, source=(0,1), target=(5,4))
>>> [(0, 1), (1, 1), (3, 2), (5, 4)]  # A list of ordered points

更新:如果起点和终点未知,且数据相对分散,则可以通过查找图中的团来找到端点。起点和终点将形成一个团。如果从团中删除最长的边,则会在图中创建一个自由端点,可用作起点和终点。例如,在此列表中,起点和终点出现在中间位置:
X = [(0, 1), (0, 0), (2, 1),  (3, 2),  (9, 4), (5, 4)]

enter image description here

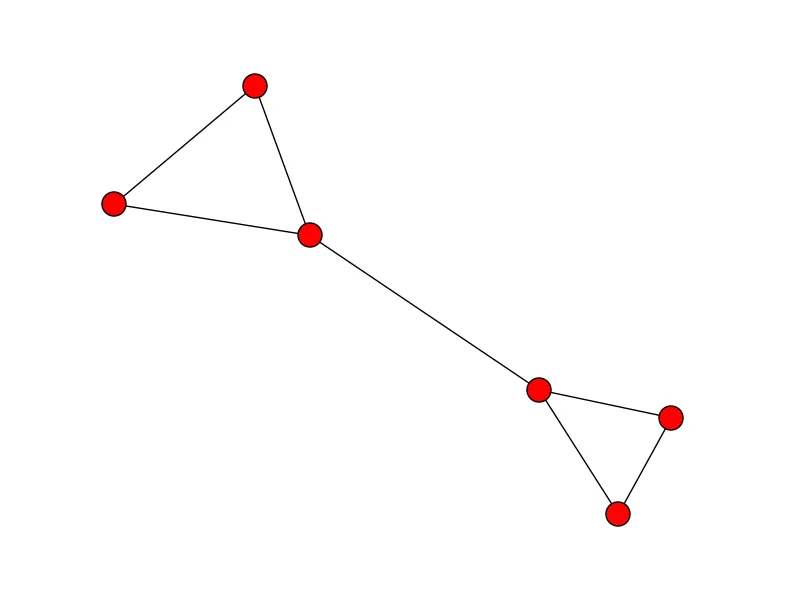
建立图表后,现在的问题是从团中删除最长的边,以找到图表的自由端点:

def find_longest_edge(l):
    e1 = G[l[0]][l[1]]['weight']
    e2 = G[l[0]][l[2]]['weight']
    e3 = G[l[1]][l[2]]['weight']
    if e2 < e1 > e3:
        return (l[0], l[1])
    elif e1 < e2 > e3:
        return (l[0], l[2])
    elif e1 < e3 > e2:
    return (l[1], l[2])

end_cliques = [i for i in list(nx.find_cliques(G)) if len(i) == 3]
edge_lengths = [find_longest_edge(i) for i in end_cliques]
G.remove_edges_from(edge_lengths)
edges = G.edges()

enter image description here

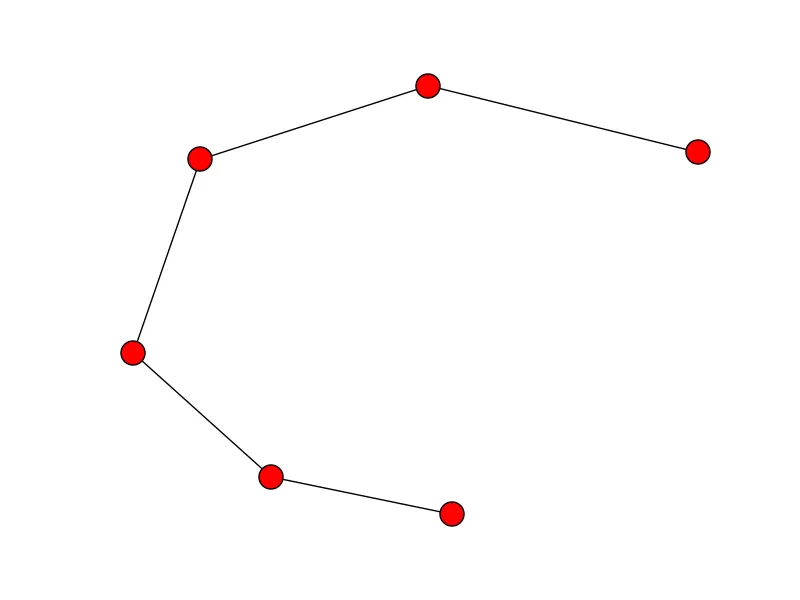
start_end = [n for n,nbrs in G.adjacency_iter() if len(nbrs.keys()) == 1]
print nx.shortest_path(G, source=start_end[0], target=start_end[1])
>>> [(0, 0), (0, 1), (2, 1), (3, 2), (5, 4), (9, 4)]  # The correct path

我本来想说:现在我该如何对图边列表进行排序?也许networkx中有我所缺失的实用函数? - jlarsch
也许我表达不够清楚,但重点不是画线,而是获得一个可以输入样条拟合算法的坐标排序列表。为此,据我所知,该列表必须排序。 - jlarsch
1
我建议看看Imanol提出的.kneighbors_graph(),或者查看nx.shortes_path()函数:print nx.shortest_path(G, source=(0,1), target=(5,4))。 - kezzos
@jlarsch,以下是我的答案,用于自动查找这些点。然而,如果这些点以完全相同的距离进行采样,您可以选择具有更大距离的2个点作为其2个最近邻的点,因为对于边缘点,最接近的两个点将会更远。 - Imanol Luengo
您IP地址为143.198.54.68,由于运营成本限制,当前对于免费用户的使用频率限制为每个IP每72小时10次对话,如需解除限制,请点击左下角设置图标按钮(手机用户先点击左上角菜单按钮)。 - jlarsch
显示剩余6条评论

5

我同意Imanol_Luengo Imanol Luengo的解决方案,但是如果您知道第一个点的索引,则有一种相当简单的解决方案只使用NumPy:

def order_points(points, ind):
    points_new = [ points.pop(ind) ]  # initialize a new list of points with the known first point
    pcurr      = points_new[-1]       # initialize the current point (as the known point)
    while len(points)>0:
        d      = np.linalg.norm(np.array(points) - np.array(pcurr), axis=1)  # distances between pcurr and all other remaining points
        ind    = d.argmin()                   # index of the closest point
        points_new.append( points.pop(ind) )  # append the closest point to points_new
        pcurr  = points_new[-1]               # update the current point
    return points_new

这种方法似乎在正弦曲线示例中表现良好,特别是因为可以将第一个点定义为最左侧或最右侧的点。

对于问题中引用的img_skeleton数据,类似地可以通过算法获得第一个点,例如作为最上方的点。

# create sine curve:
x      = np.linspace(0, 2 * np.pi, 100)
y      = np.sin(x)

# shuffle the order of the x and y coordinates:
idx    = np.random.permutation(x.size)
xs,ys  = x[idx], y[idx]   # shuffled points

# find the leftmost point:
ind    = xs.argmin()

# assemble the x and y coordinates into a list of (x,y) tuples:
points = [(xx,yy)  for xx,yy in zip(xs,ys)]

# order the points based on the known first point:
points_new = order_points(points, ind)

# plot:
fig,ax = plt.subplots(1, 2, figsize=(10,4))
xn,yn  = np.array(points_new).T
ax[0].plot(xs, ys)  # original (shuffled) points
ax[1].plot(xn, yn)  # new (ordered) points
ax[0].set_title('Original')
ax[1].set_title('Ordered')
plt.tight_layout()
plt.show()

ordered_points


请注意,最左侧的点可能并不总是一个端点。考虑将正弦波旋转90度——即我们不能假设“最高点”位置是一个端点。 - georgedeath
1
同意。这个解决方案需要知道第一个点的索引。如果你可以通过算法或手动方式找到第一个点,那么这个仅使用numpy的解决方案似乎是最简单的。 - ToddP

4

我曾经有完全相同的问题。如果您有两个散布的x和y值的数组,这些值不太弯曲,那么您可以将这些点转换为PCA空间,按照PCA空间中的顺序进行排序,然后将它们转换回来。(我还添加了一些额外的平滑功能)。


enter image description here
import numpy as np
from scipy.signal import savgol_filter
from sklearn.decomposition import PCA

def XYclean(x,y): 

    xy = np.concatenate((x.reshape(-1,1), y.reshape(-1,1)), axis=1)     

    # make PCA object
    pca = PCA(2)
    # fit on data
    pca.fit(xy)
    
    #transform into pca space   
    xypca = pca.transform(xy) 
    newx = xypca[:,0]
    newy = xypca[:,1]

    #sort
    indexSort = np.argsort(x)
    newx = newx[indexSort]
    newy = newy[indexSort]

    #add some more points (optional)
    f = interpolate.interp1d(newx, newy, kind='linear')        
    newX=np.linspace(np.min(newx), np.max(newx), 100)
    newY = f(newX)            

    #smooth with a filter (optional)
    window = 43
    newY = savgol_filter(newY, window, 2)

    #return back to old coordinates
    xyclean = pca.inverse_transform(np.concatenate((newX.reshape(-1,1), newY.reshape(-1,1)), axis=1) )
    xc=xyclean[:,0]
    yc = xyclean[:,1]

    return xc, yc

2

我正在处理一个类似的问题,但它有一个重要的限制(与OP所给的示例非常相似),即每个像素在8连通意义下只有一个或两个相邻像素。在这种限制下,有一个非常简单的解决方案。

def sort_to_form_line(unsorted_list):
    """
    Given a list of neighboring points which forms a line, but in random order, 
    sort them to the correct order.
    IMPORTANT: Each point must be a neighbor (8-point sense) 
    to a least one other point!
    """
    sorted_list = [unsorted_list.pop(0)]

    while len(unsorted_list) > 0:
        i = 0
        while i < len(unsorted_list):
            if are_neighbours(sorted_list[0], unsorted_list[i]):
                #neighbours at front of list
                sorted_list.insert(0, unsorted_list.pop(i))
            elif are_neighbours(sorted_list[-1], unsorted_list[i]):
                #neighbours at rear of list
                sorted_list.append(unsorted_list.pop(i))
            else:
                i = i+1

    return sorted_list

def are_neighbours(pt1, pt2):
    """
    Check if pt1 and pt2 are neighbours, in the 8-point sense
    pt1 and pt2 has integer coordinates
    """
    return (np.abs(pt1[0]-pt2[0]) < 2) and (np.abs(pt1[1]-pt2[1]) < 2)

0

Toddp的回答基础上进行修改,您可以使用这段代码查找任意形状线条的端点,并按照Toddp所述的方式对这些点进行排序,这比Imanol Luengo的回答要快得多。唯一的限制是该线条必须仅具有2个端点:

def order_points(points):
  if isinstance(points,np.ndarray): 
    assert points.shape[1]==2
    points = points.tolist()

  exts = get_end_points(points)
  assert len(exts) ==2
  ind = points.index(exts[0])

  points_new = [ points.pop(ind) ]  # initialize a new list of points with the known first point
  pcurr      = points_new[-1]       # initialize the current point (as the known point)
  while len(points)>0:
      d      = np.linalg.norm(np.array(points) - np.array(pcurr), axis=1)  # distances between pcurr and all other remaining points
      ind    = d.argmin()                   # index of the closest point
      points_new.append( points.pop(ind) )  # append the closest point to points_new
      pcurr  = points_new[-1]               # update the current point
  return points_new

def get_end_points(ptsxy):
  #source : https://dev59.com/ycDqa4cB1Zd3GeqPbVeE#67145008
  if isinstance(ptsxy,list): ptsxy = np.array(ptsxy)
  assert ptsxy.shape[1]==2
  #translate to (0,0)for faster excution

  xx,yy,w,h = cv2.boundingRect(ptsxy)
  pts_translated = ptsxy -(xx,yy)
  bim = np.zeros((h+1,w+1))
  bim[[*np.flip(pts_translated).T]]=255
  extremes = []    
  for p in pts_translated:
    x = p[0]
    y = p[1]
    n = 0        
    n += bim[y - 1,x]
    n += bim[y - 1,x - 1]
    n += bim[y - 1,x + 1]
    n += bim[y,x - 1]    
    n += bim[y,x + 1]    
    n += bim[y + 1,x]    
    n += bim[y + 1,x - 1]
    n += bim[y + 1,x + 1]
    n /= 255        
    if n == 1:
      extremes.append(p)
  extremes = np.array(extremes)+(xx,yy)
  return extremes.tolist()


网页内容由stack overflow 提供, 点击上面的
可以查看英文原文,
原文链接