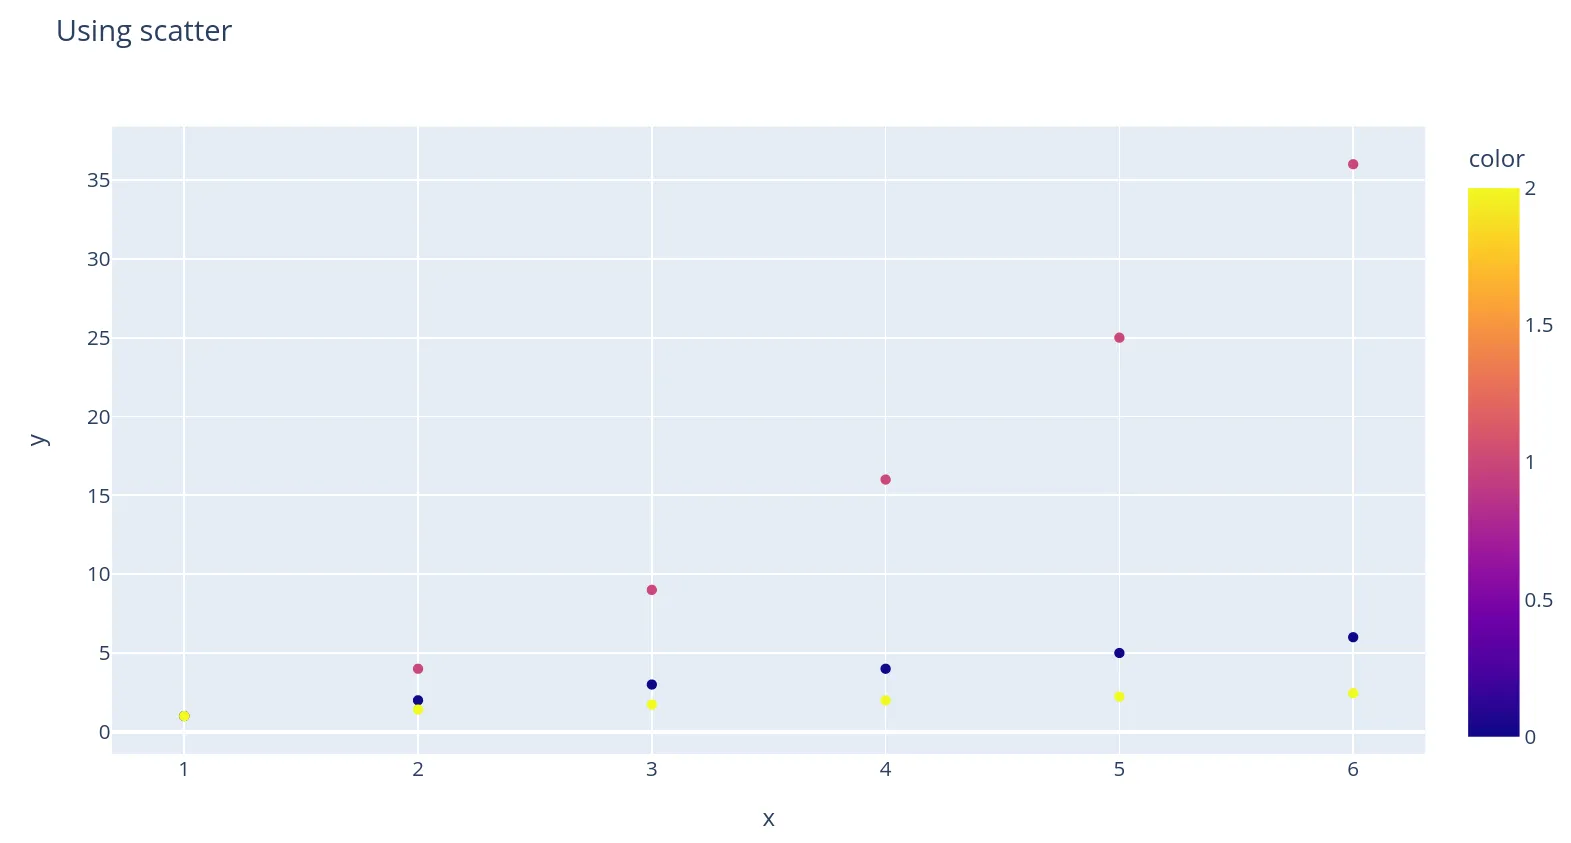
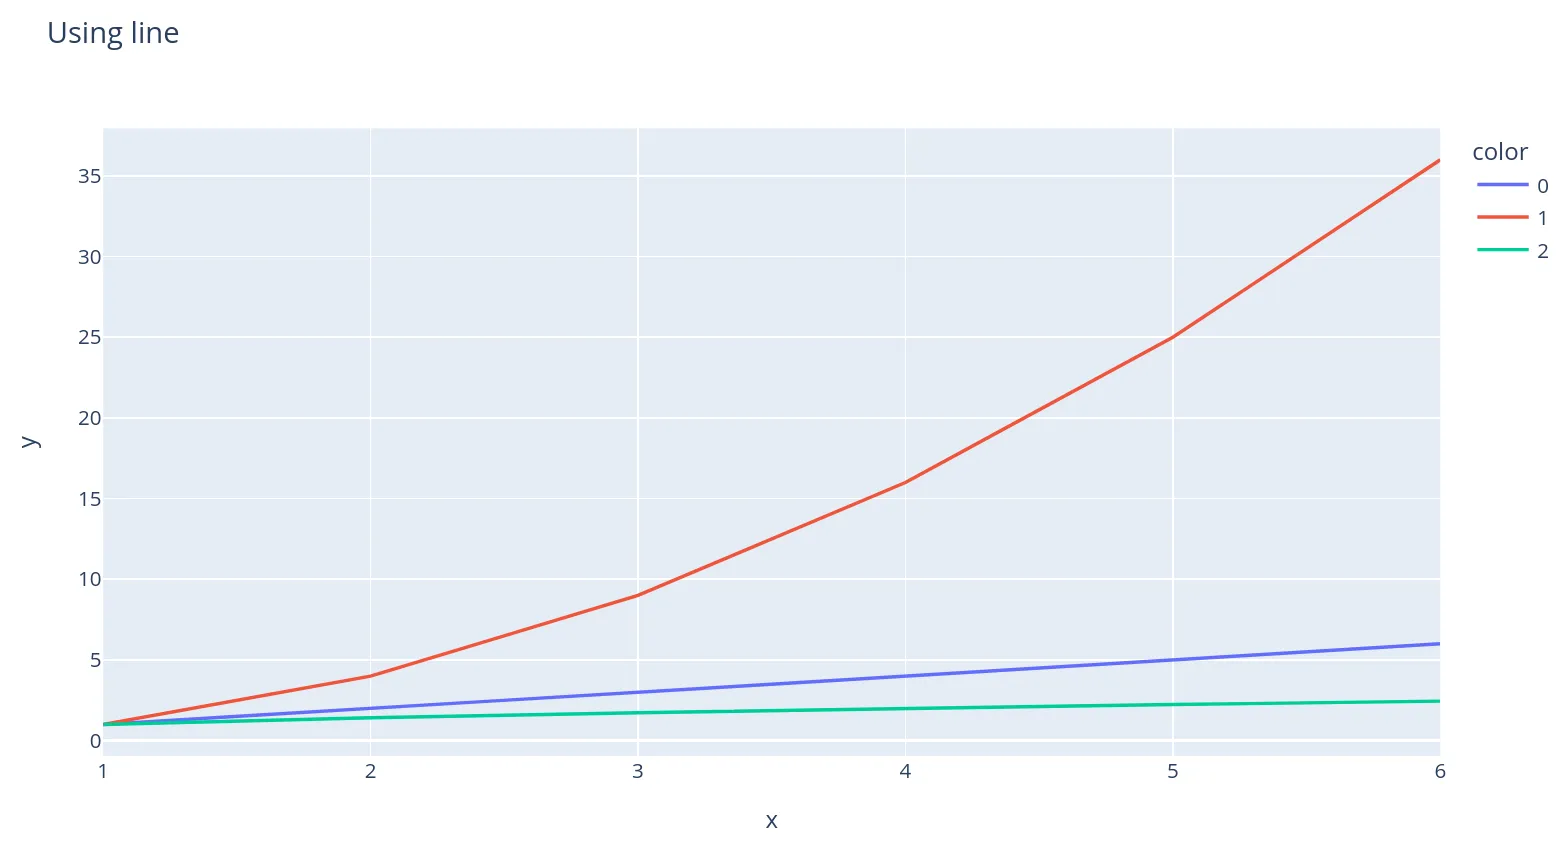
我不确定仅使用plotly.express是否可能。如果你使用px.line,那么你可以像这个答案所描述的那样传递参数markers=True,但从px.line文档中看来,并不支持连续的颜色比例尺。
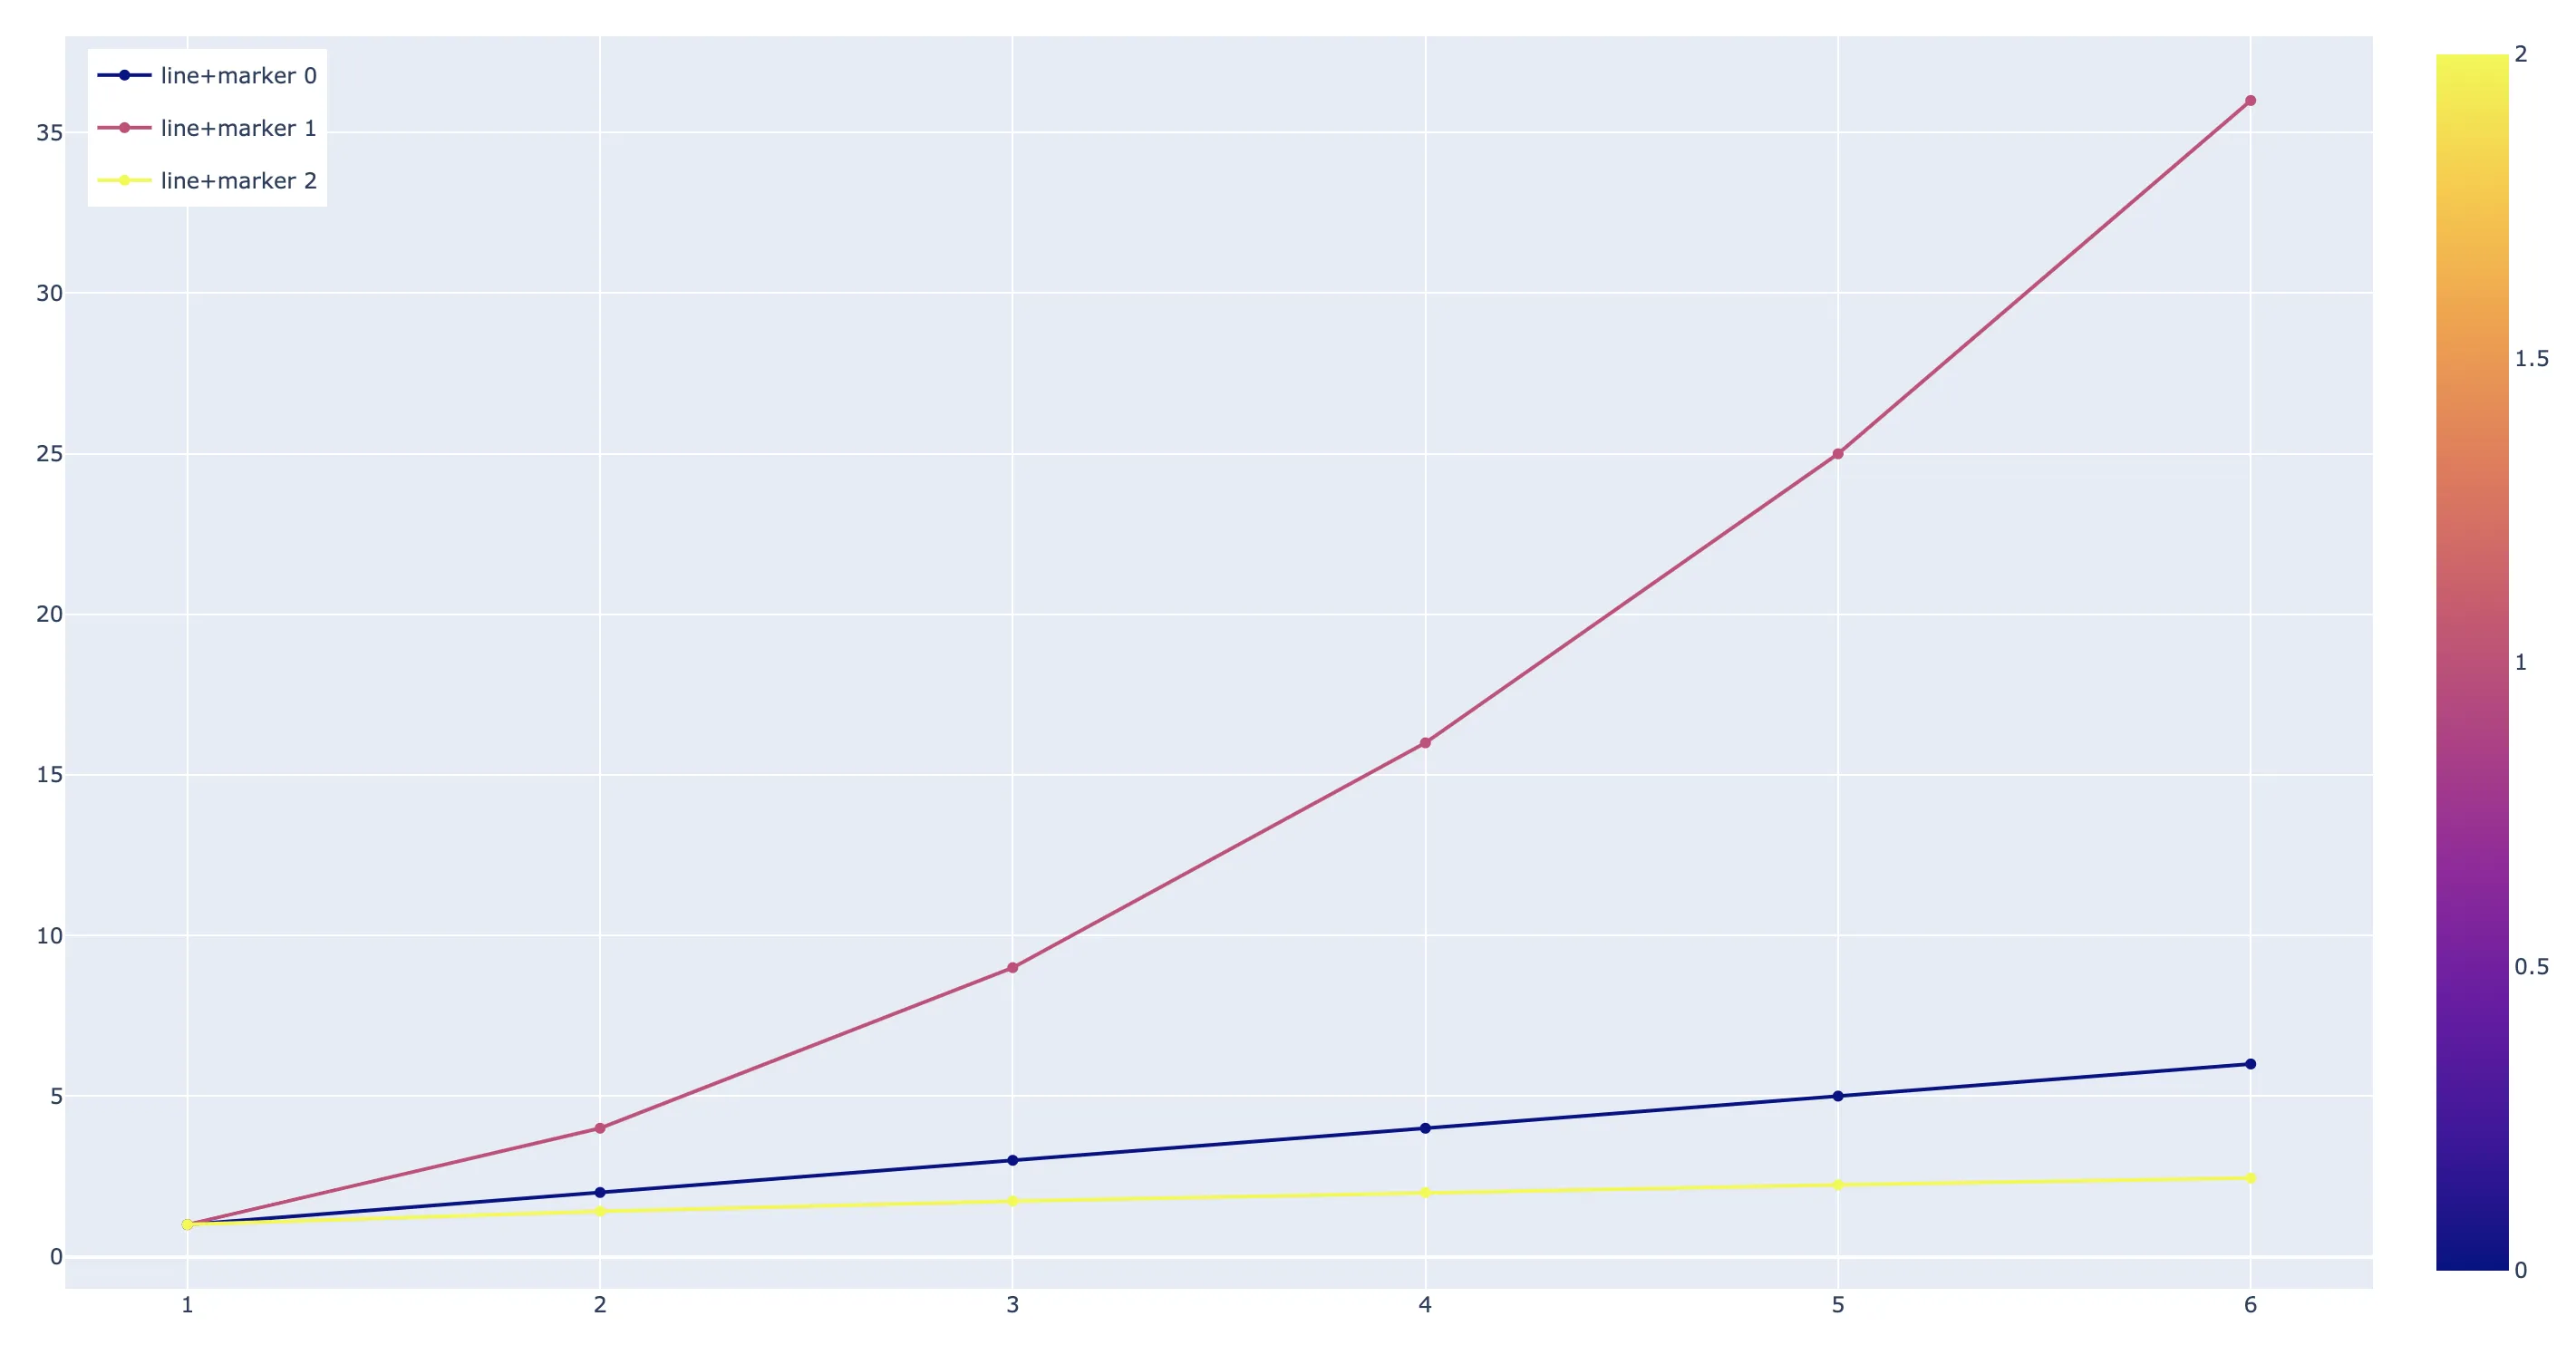
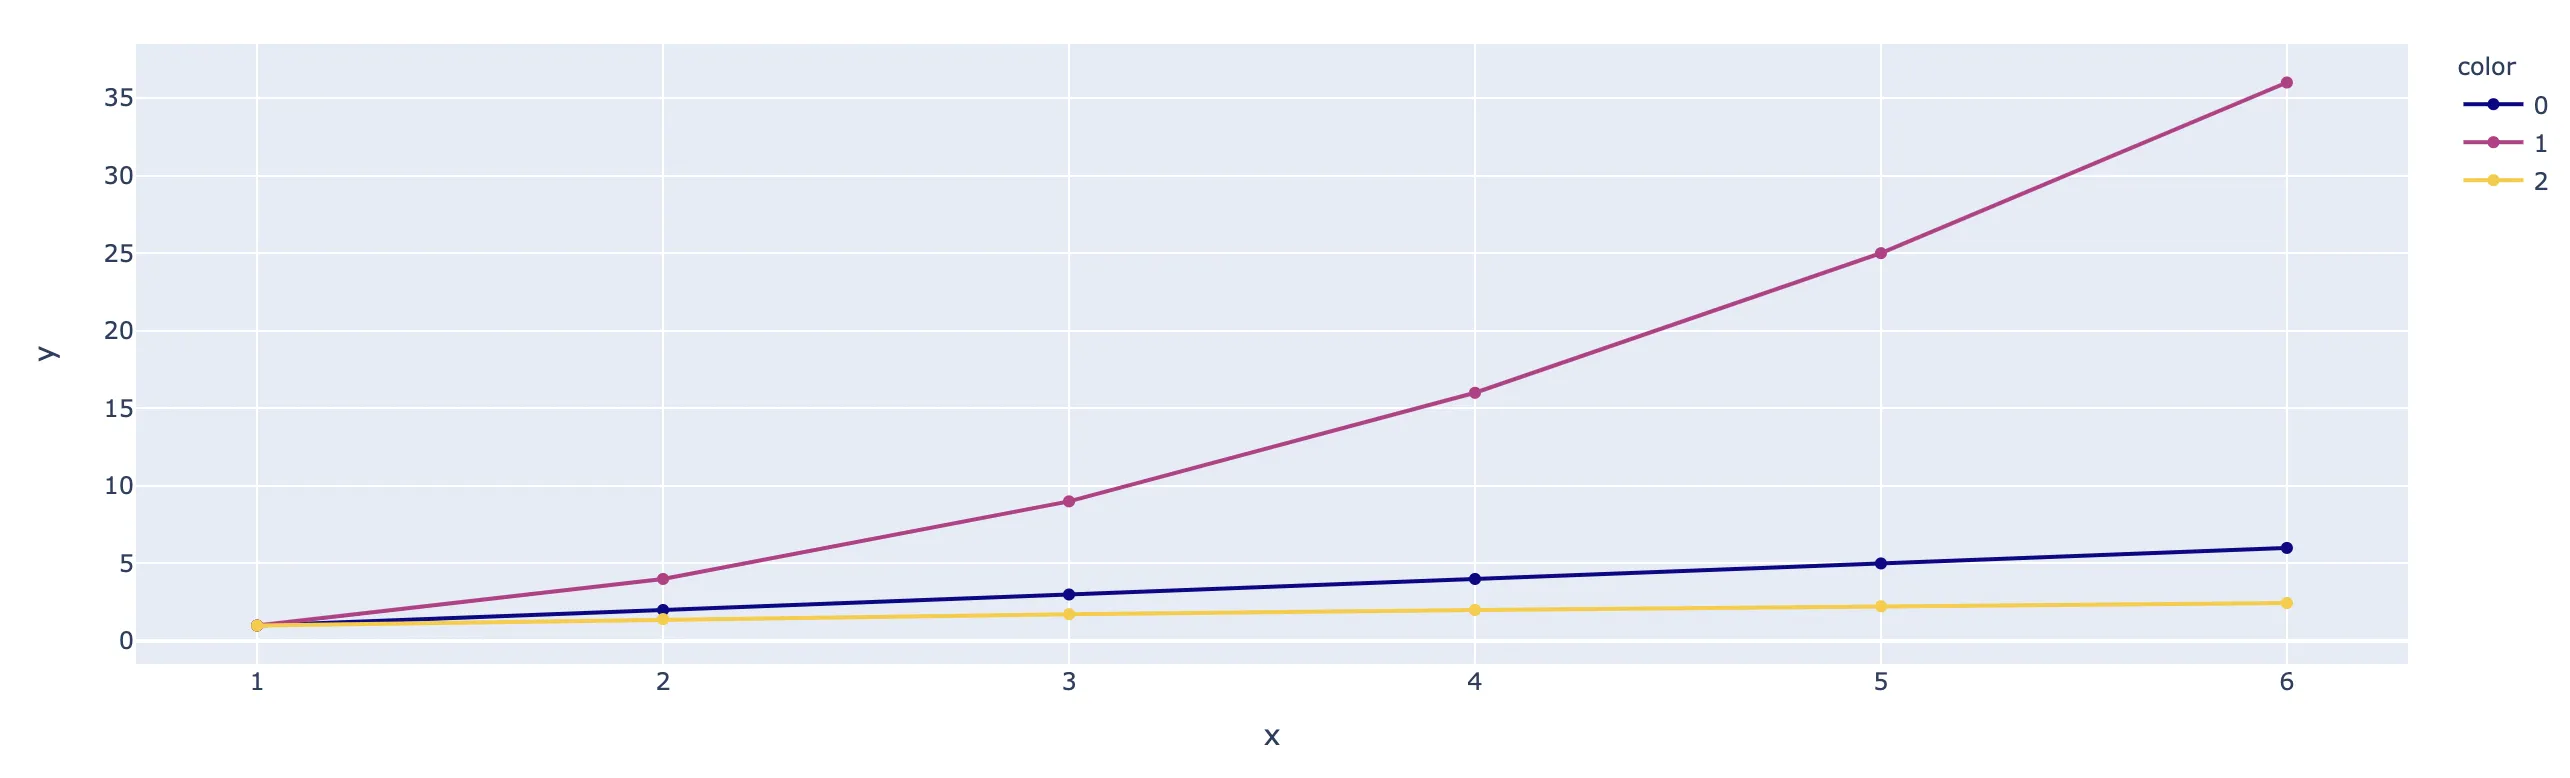
更新的答案:要同时拥有将线和标记分组的图例,最简单的方法可能是使用go.Scatter和参数mode='lines+markers'。你需要一次添加一个迹线(通过逐一绘制数据的每个唯一颜色部分),以便能够从图例中控制每个线+标记组。
在绘制这些迹线时,你需要一些函数从连续的颜色比例尺中检索线的颜色,因为go.Scatter不会知道你的线应该是什么颜色,除非你指定它们——值得庆幸的是,在这里有一个回答。
此外,你不能通过逐个颜色添加标记来生成颜色条,因此,你可以一次性使用go.Scatter绘制所有标记,但使用参数marker=dict(size=0, color="rgba(0,0,0,0)", colorscale='Plasma', colorbar=dict(thickness=20))来显示颜色条,但确保这些重复标记不可见。
把这些组合在一起:
import plotly.graph_objects as go
import pandas as pd
import numpy as np
x = [1,2,3,4,5,6]
df = pd.DataFrame(
{
'x': x*3,
'y': list(np.array(x)) + list(np.array(x)**2) + list(np.array(x)**.5),
'color': list(np.array(x)*0) + list(np.array(x)*0+1) + list(np.array(x)*0+2),
}
)
def get_color(colorscale_name, loc):
from _plotly_utils.basevalidators import ColorscaleValidator
cv = ColorscaleValidator("colorscale", "")
colorscale = cv.validate_coerce(colorscale_name)
if hasattr(loc, "__iter__"):
return [get_continuous_color(colorscale, x) for x in loc]
return get_continuous_color(colorscale, loc)
import plotly.colors
from PIL import ImageColor
def get_continuous_color(colorscale, intermed):
"""
Plotly continuous colorscales assign colors to the range [0, 1]. This function computes the intermediate
color for any value in that range.
Plotly doesn't make the colorscales directly accessible in a common format.
Some are ready to use:
colorscale = plotly.colors.PLOTLY_SCALES["Greens"]
Others are just swatches that need to be constructed into a colorscale:
viridis_colors, scale = plotly.colors.convert_colors_to_same_type(plotly.colors.sequential.Viridis)
colorscale = plotly.colors.make_colorscale(viridis_colors, scale=scale)
:param colorscale: A plotly continuous colorscale defined with RGB string colors.
:param intermed: value in the range [0, 1]
:return: color in rgb string format
:rtype: str
"""
if len(colorscale) < 1:
raise ValueError("colorscale must have at least one color")
hex_to_rgb = lambda c: "rgb" + str(ImageColor.getcolor(c, "RGB"))
if intermed <= 0 or len(colorscale) == 1:
c = colorscale[0][1]
return c if c[0] != "#" else hex_to_rgb(c)
if intermed >= 1:
c = colorscale[-1][1]
return c if c[0] != "#" else hex_to_rgb(c)
for cutoff, color in colorscale:
if intermed > cutoff:
low_cutoff, low_color = cutoff, color
else:
high_cutoff, high_color = cutoff, color
break
if (low_color[0] == "#") or (high_color[0] == "#"):
low_color = hex_to_rgb(low_color)
high_color = hex_to_rgb(high_color)
return plotly.colors.find_intermediate_color(
lowcolor=low_color,
highcolor=high_color,
intermed=((intermed - low_cutoff) / (high_cutoff - low_cutoff)),
colortype="rgb",
)
fig = go.Figure()
for color_val in df.color.unique():
color_val_normalized = (color_val - min(df.color)) / (max(df.color) - min(df.color))
df_subset = df[df['color'] == color_val]
fig.add_trace(go.Scatter(
x=df_subset['x'],
y=df_subset['y'],
mode='lines+markers',
marker=dict(color=get_color('Plasma', color_val_normalized)),
name=f"line+marker {color_val}",
legendgroup=f"line+marker {color_val}"
))
fig.add_trace(go.Scatter(
x=df['x'],
y=df['y'],
mode='markers',
marker=dict(
size=0,
color="rgba(0,0,0,0)",
colorscale='Plasma',
cmin=min(df.color),
cmax=max(df.color),
colorbar=dict(thickness=40)
),
showlegend=False
))
fig.update_layout(
legend=dict(
yanchor="top",
y=0.99,
xanchor="left",
x=0.01),
yaxis_range=[min(df.y)-2,max(df.y)+2]
)
fig.show()
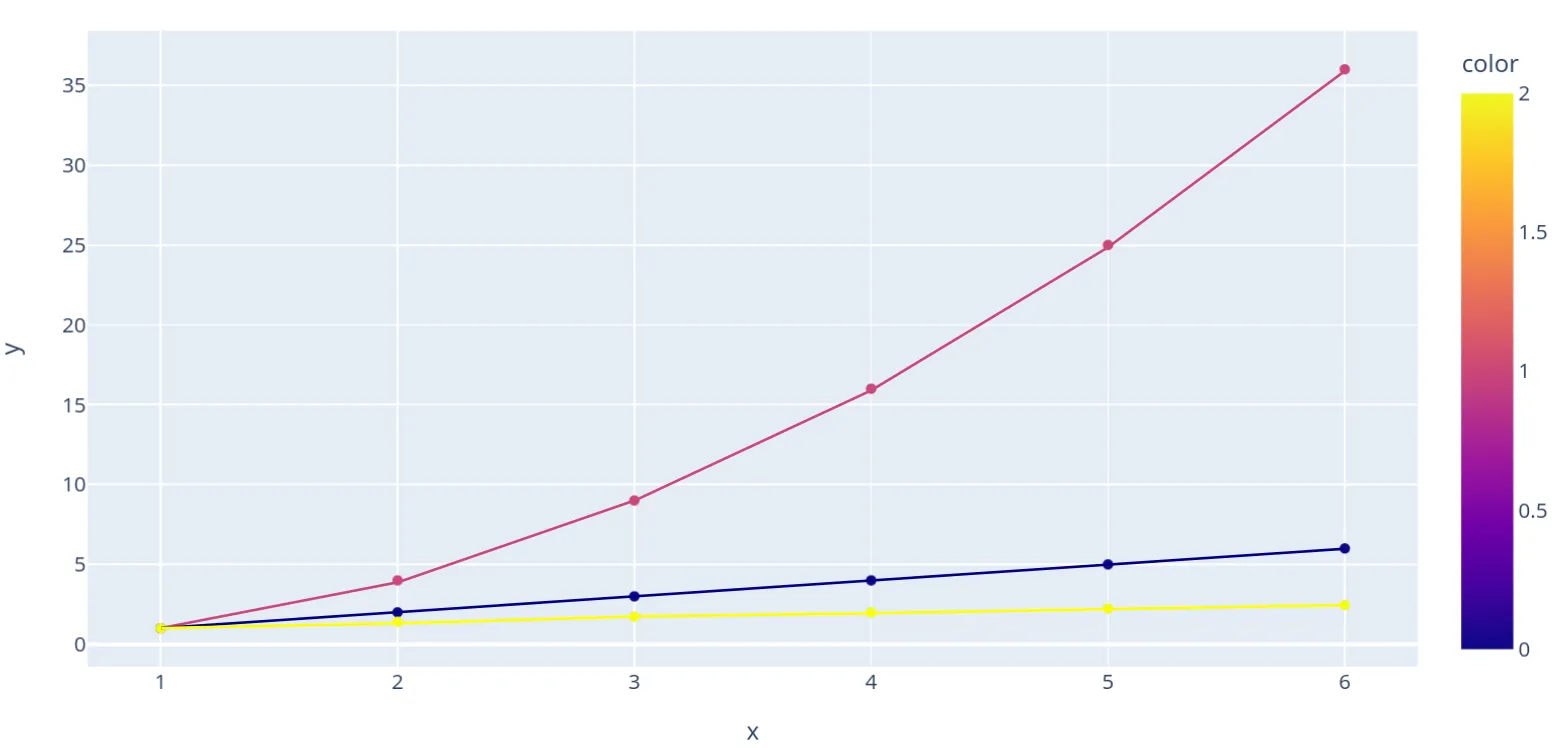
fig = px.line(df, x='x', y='y', color='color', markers=True, color_discrete_sequence=['#0d0887','#d8576b','#f0f921'])- r-beginnersplotly.express.line函数默认情况下不支持此功能。 - user171780color_discrete_sequence(正如@r-beginners所指出的那样)是最自然的解决方案,而且确实支持Plotly Express线图! - matanster