Plotly:如何更改 Plotly Express 散点图的颜色方案?

25

我想使用plotly,具体来说是ploty express,来创建一些可视化图表。
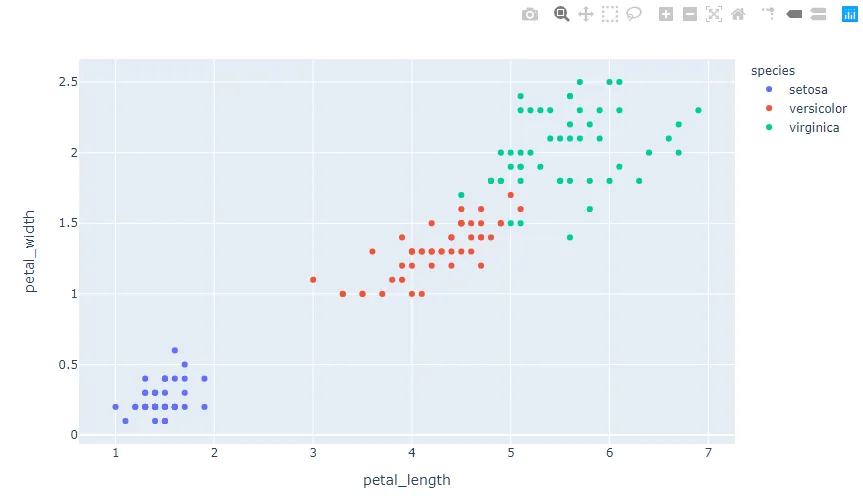
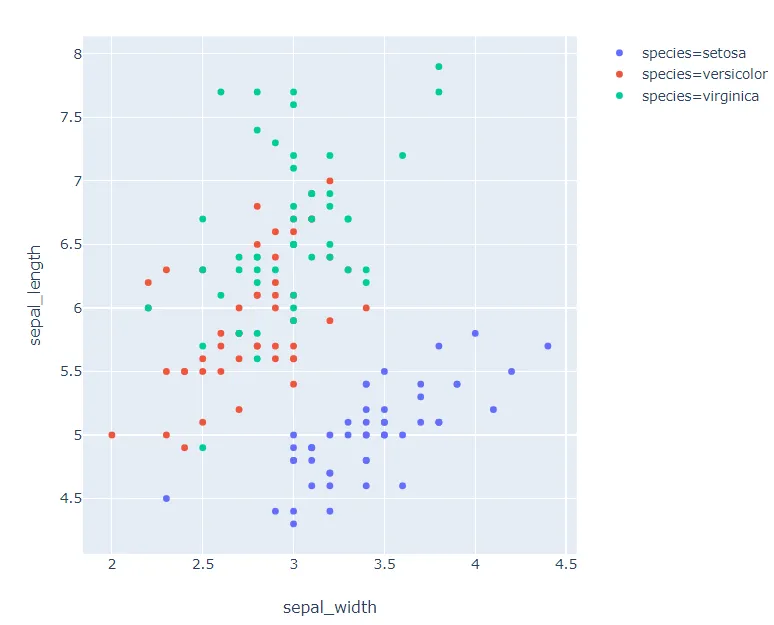
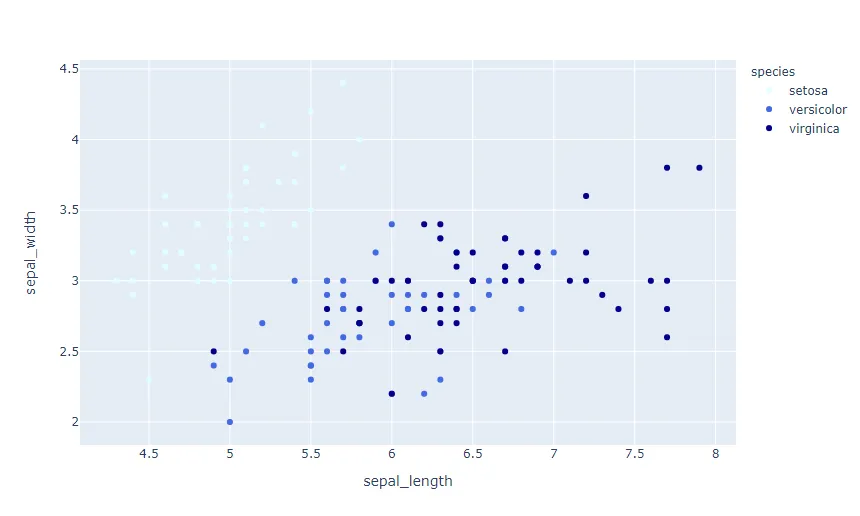
我正在制作的其中之一是散点图

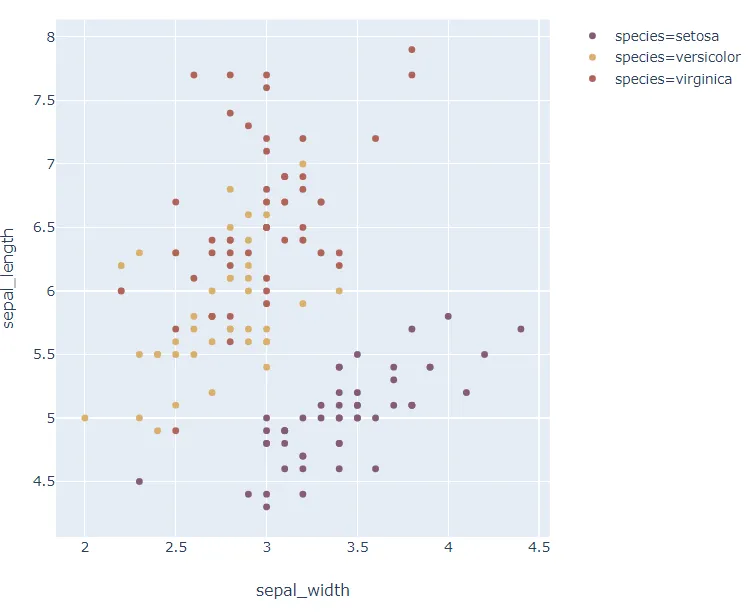
我有一些代码如下,可以生成一个漂亮的散点图:

import plotly.graph_objs as go, pandas as pd, plotly.express as px
df = pd.read_csv('iris.csv')
fig = px.scatter(df, x='sepal_length', y='sepal_width',
              color='species', marker_colorscale=px.colors.sequential.Viridis)
fig.show()

图片描述

然而,我想尝试改变配色方案,即为每个物种呈现的颜色。

我阅读了:

但无法更改颜色。

尝试中:

fig = px.scatter(df, x='sepal_length', y='sepal_width',
              color='species', marker_colorscale=px.colors.sequential.Viridis)
产生:
---------------------------------------------------------------------------
TypeError                                 Traceback (most recent call last)
<ipython-input-6-78a9d58dce23> in <module>
      2 # https://plotly.com/python/line-and-scatter/
      3 fig = px.scatter(df, x='sepal_length', y='sepal_width',
----> 4               color='species', marker_colorscale=px.colors.sequential.Viridis)
      5 fig.show()

TypeError: scatter() got an unexpected keyword argument 'marker_colorscale'

尝试中

fig = px.scatter(df, x='sepal_length', y='sepal_width',
              color='species', continuous_colorscale=px.colors.sequential.Viridis)
产生:
---------------------------------------------------------------------------
TypeError                                 Traceback (most recent call last)
<ipython-input-6-78a9d58dce23> in <module>
      2 # https://plotly.com/python/line-and-scatter/
      3 fig = px.scatter(df, x='sepal_length', y='sepal_width',
----> 4               color='species', continuous_colorscale=px.colors.sequential.Viridis)
      5 fig.show()

TypeError: scatter() got an unexpected keyword argument 'continuous_colorscale'

我该如何在 plotly 可视化中更改使用的颜色?

2个回答

32

通常,更改Plotly Express图的颜色方案非常简单。导致问题的原因是species分类变量。连续或数值型的值实际上更容易,但稍后我们会讨论到这点。

对于分类值,使用color_discrete_map是一种完全有效但繁琐的方法。我更喜欢将关键字参数continuous_colorscalepx.colors.qualitative.Antique结合使用,其中Antique可以更改为在plotly express中提供的任何离散颜色方案。只需运行dir(px.colors.qualitative)以查看您正在运行的plotly版本中可用的内容:

['Alphabet',
 'Antique',
 'Bold',
 'D3',
 'Dark2',
 'Dark24',
 'G10',......]

代码1:

import plotly.express as px
df = px.data.iris()
fig = px.scatter(df, x="sepal_width", y="sepal_length",
                 color="species", color_discrete_sequence=px.colors.qualitative.Antique)

fig.show()

情节 1:

输入图像描述

连续变量怎么办?

请考虑以下片段:

import plotly.express as px
df = px.data.iris()
fig = px.scatter(df, x="sepal_width", y="sepal_length",
                 color="sepal_length", color_continuous_scale=px.colors.sequential.Viridis)

fig.show()

运行此代码将生成以下图表:

enter image description here

您可以将颜色更改为任何其他可用主题下的颜色dir(px.colors.sequential),例如color_continuous_scale=px.colors.sequential.Inferno,并获得以下图表:

enter image description here

这里可能会造成困惑的是,设置color='species',并保持color_continuous_scale=px.colors.sequential.Inferno将给您这张图表:

enter image description here

现在,该图直接跳回使用Plotly默认颜色,不会提醒您color_continuous_scale=px.colors.sequential.Inferno没有任何效果。 这是因为species是一个具有不同值:['setosa','versicolor','virginica']的分类变量,因此color_continuous_scale被简单地忽略。 要使color_continuous_scale生效,您必须使用数字值,例如sepal_length = [5.1, 4.9, 4.7, 4.6, 5. , 5.4, ...]

这就把我们带回到了针对分类变量的初始答案:


结合使用关键字参数continuous_colorscalepx.colors.qualitative


如果您使用go.Figure将两个图表相加,类似于https://dev59.com/xVEG5IYBdhLWcg3wfveM#65134290,会发生什么? - Sterling
如果您想要在更新语句中指定 color_discrete_sequence 的值而非直接在图表初始化 API 中指定,该如何实现呢? - matanster
Sterling: 我测试了在叠加堆积条形图上叠加两个散点图,并为每个图设置了不同的“color_discrete_sequence”(在合并之前),看起来运行正常。你遇到了具体问题吗? - eton blue

16
你可以使用一种名为color_discrete_map的方法,它是一个包含k,v对的字典,其中k是颜色值,v是颜色方案。例如:
fig = px.scatter(df, x='sepal_length', y='sepal_width',
              color='species', color_discrete_map={'setosa': 'lightcyan', 
                                                   'versicolor': 'royalblue', 'virginica': 'darkblue'})

enter image description here


网页内容由stack overflow 提供, 点击上面的
可以查看英文原文,
原文链接