https://plotly.com/python/line-and-scatter/有许多散点图例子,但没有一个示范如何在px.scatter中设置所有点的颜色:
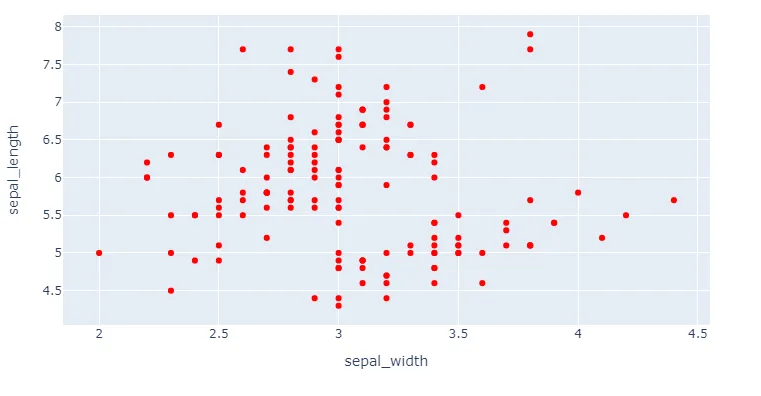
# x and y given as DataFrame columns
import plotly.express as px
df = px.data.iris() # iris is a pandas DataFrame
fig = px.scatter(df, x="sepal_width", y="sepal_length")
fig.show()
我尝试了添加 colour = 'red' 之类的方法,但并没有起作用。这些示例仅显示如何通过其他变量着色。
原则上,我可以添加另一个特征并将其全部设置为相同,但这似乎是一种奇怪的完成任务的方式......
surfacecolor的go.Surface,怎么样? - aviator