更新:在Plotly.py的v5版本中已经移除了
Aa,所以下面回答中的这部分内容适用于v4及以下版本。
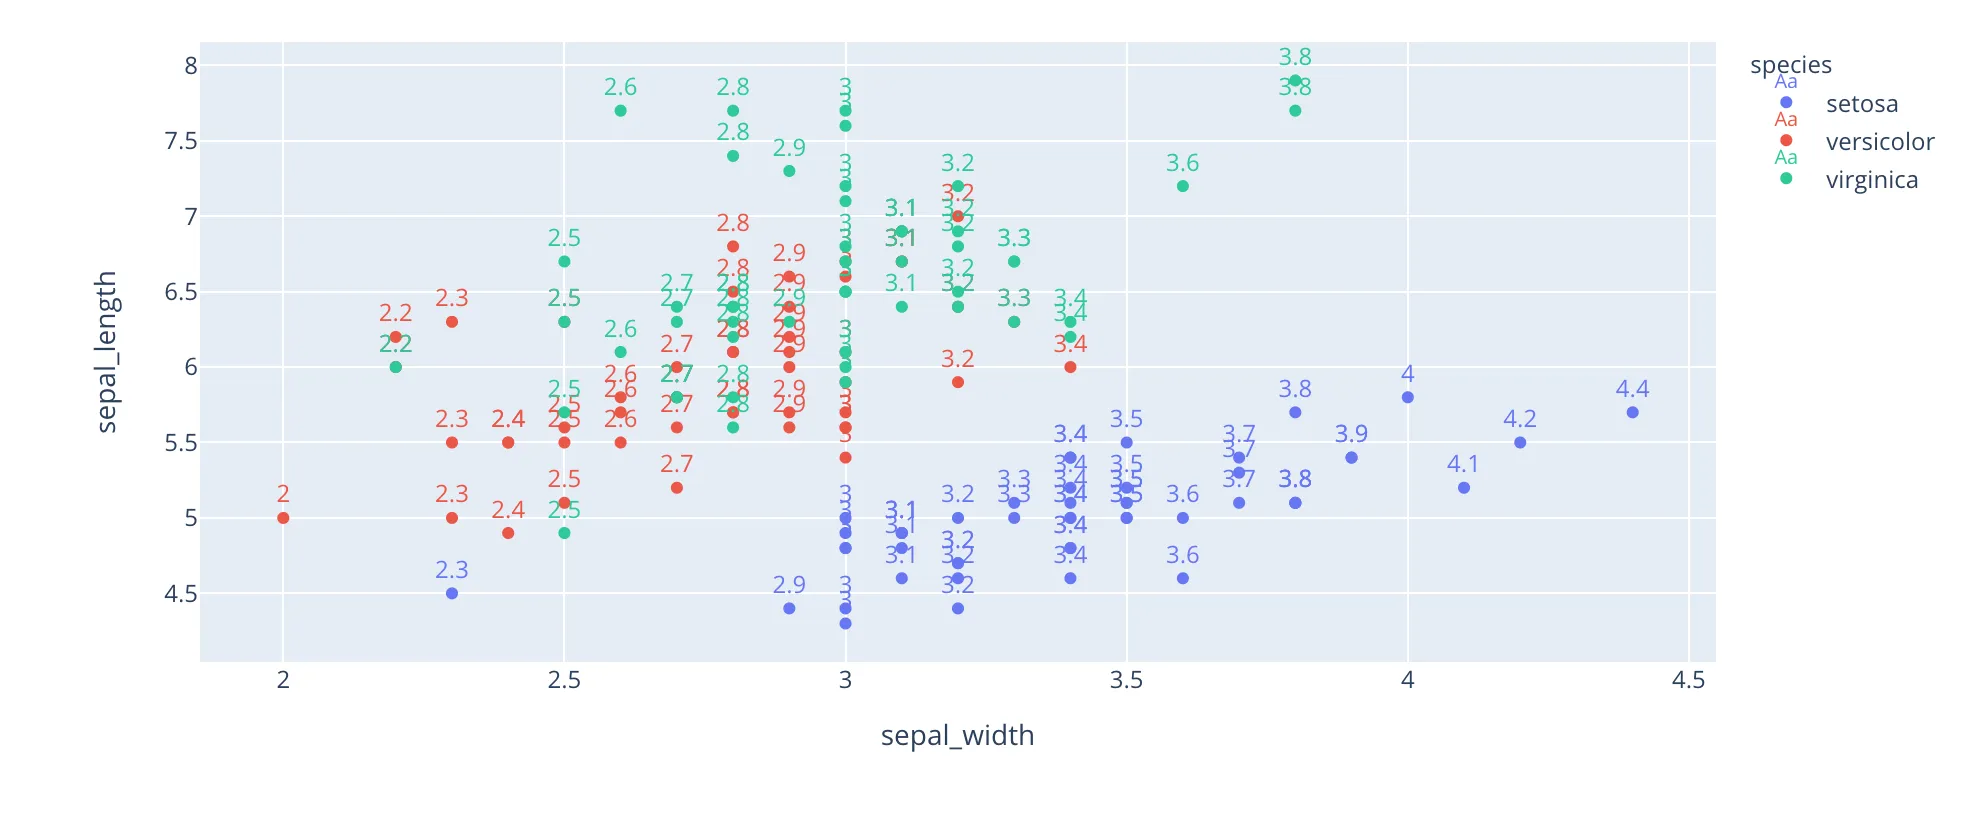
以下是如何使用
for_each_trace将文本颜色与标记颜色匹配的方法:
import plotly.express as px
df = px.data.iris()
fig = px.scatter(df, x="sepal_width", y="sepal_length", color="species",  text='sepal_width')
fig.for_each_trace(lambda t: t.update(textfont_color=t.marker.color, textposition='top center'))
fig.show()
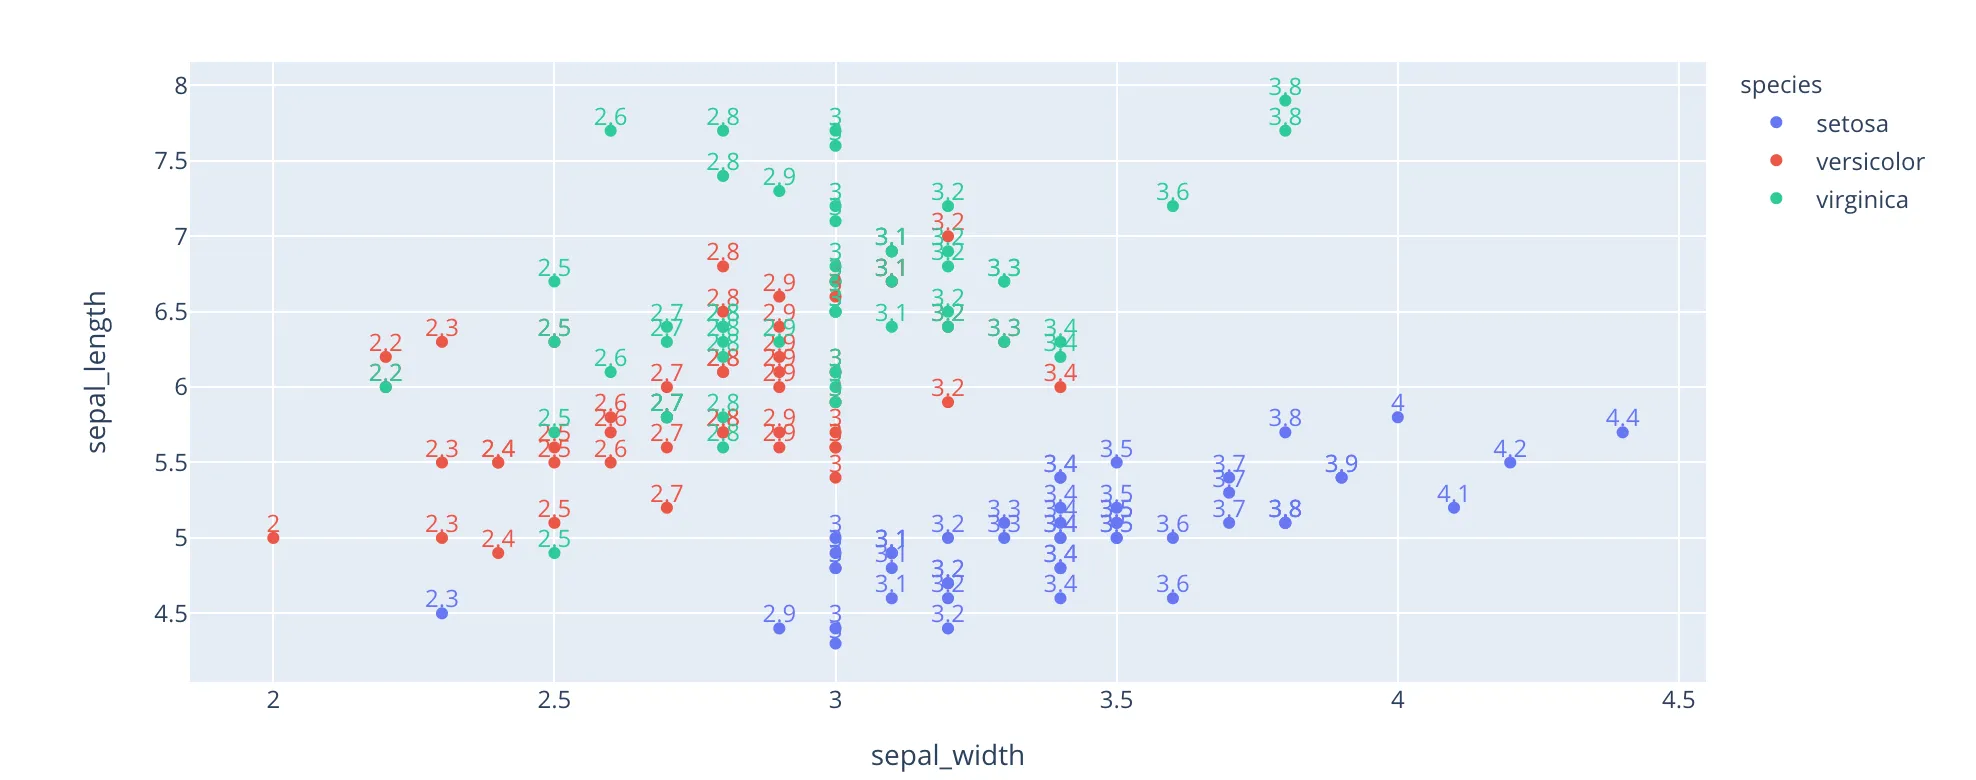
关于图例,我认为使用上述代码后已经看起来更好了,但是没有关闭此选项的选项。您可以尝试一种方法,其中您有两个跟踪,一个只有标记,另一个只有文本,并且只有一个带有文本而不出现在图例中,例如:
import plotly.express as px

df = px.data.iris()
fig = px.scatter(df, x="sepal_width", y="sepal_length", color="species", text='sepal_width')
def add_trace_copy(trace):
    fig.add_traces(trace)
    new_trace = fig.data[-1]
    new_trace.update(textfont_color=trace.marker.color, textposition='top center',
                     mode="text", showlegend=False)
    trace.update(mode="markers")
fig.for_each_trace(add_trace_copy)
fig.show()
这个方法有效,但可能只适用于使用Plotly Express函数输出的图形,因为它们自动设置了legendgroup,在更复杂的图形中可能会有些脆弱 :)
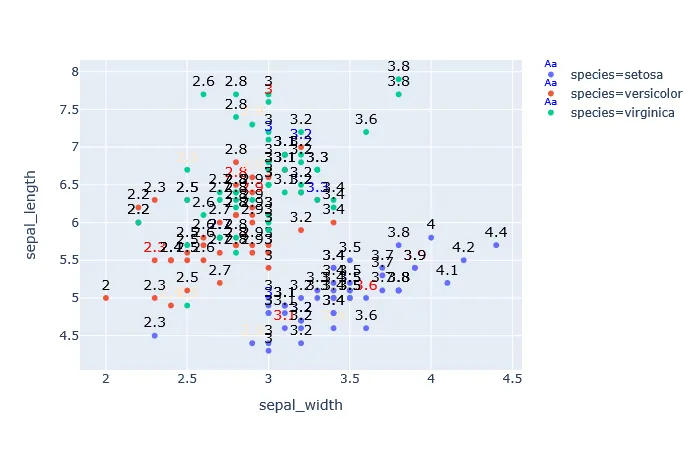
Aa,因为存在诸如此类的担忧 :) - nicolaskruchten