1个回答
2
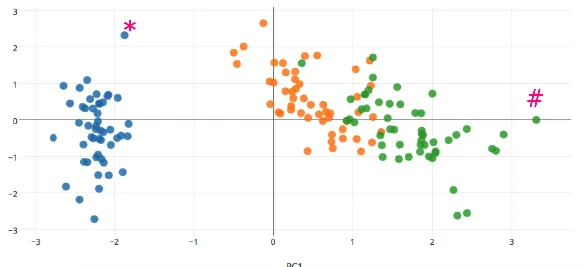
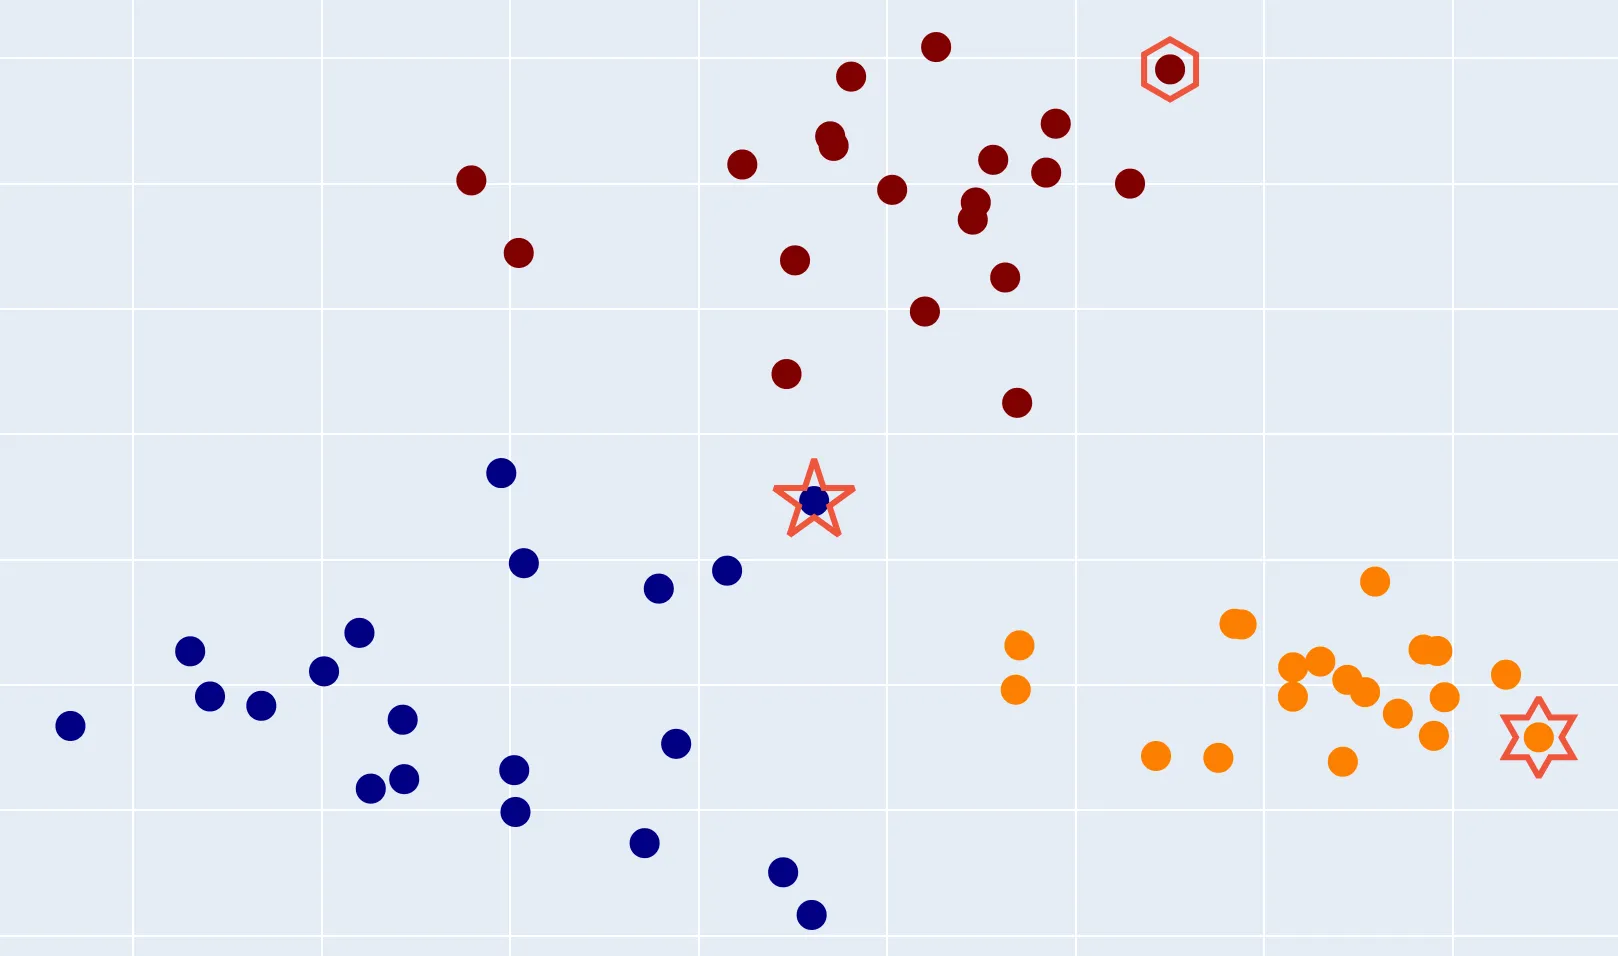
这里有一个可能适合的示例,标记可以从此页面选择。开放式标记看起来很有趣,因为它可以包含一个较小的标记。但是,您也可以在x和y上添加一个小偏移量来定位任何标记。
import random
import plotly.graph_objects as go

N = 20

x1 = [random.gauss(2, .5) for _ in range(N)]
y1 = [random.gauss(2, .5) for _ in range(N)]

x2 = [random.gauss(4, .4) for _ in range(N)]
y2 = [random.gauss(2, .2) for _ in range(N)]

x3 = [random.gauss(3, .4) for _ in range(N)]
y3 = [random.gauss(4, .3) for _ in range(N)]

# x,y for rightmost dot
max_xy = [max(zip(x1,y1)), max(zip(x2,y2)), max(zip(x3,y3))]
max_x = [m[0] for m in max_xy]
max_y = [m[1] for m in max_xy]

fig = go.Figure()
fig.add_trace(go.Scatter(
    x = x1+x2+x3,
    y = y1+y2+y3,
    mode='markers',
    marker=dict(
        size=15,
        color=[.3] * N + [.65] * N + [.8] * N,
        colorscale='jet'
    )
))
fig.add_trace(go.Scatter(
    x = max_x,
    y = max_y,
    mode='markers',
    marker=dict(
        size=30,
        line=dict(width=3, color='pink'),
        symbol=[117, 118, 114]
    )
))
fig.update_layout(showlegend=False)
fig.show()
- JohanC
网页内容由stack overflow 提供, 点击上面的可以查看英文原文,
原文链接
原文链接