我正在使用R中的Plotly创建3D散点图,并希望缩小所有点的标记大小。
library(plotly)
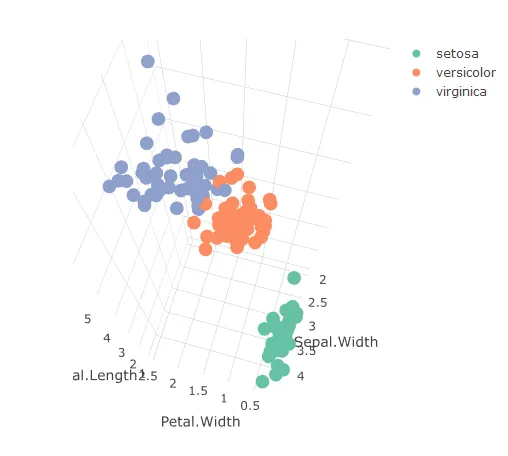
plot_ly(iris,x=~Petal.Width,y=~Sepal.Width,z=~Petal.Length) %>%
add_markers(color=~Species)
我尝试设置了 sizes 参数,但似乎没有改变任何东西。
plot_ly(iris,x=~Petal.Width,y=~Sepal.Width,z=~Petal.Length) %>%
  add_markers(color=~Species,sizes=0.02)
我也尝试了另一个参数sizeref,但仍然没有发生任何变化。
plot_ly(iris,x=~Petal.Width,y=~Sepal.Width,z=~Petal.Length) %>%
  add_markers(color=~Species,marker=list(sizeref=0.02))
是否有其他解决方案来减小所有点的标记大小?或者我做错了什么吗?
